Introduction to Quality Control Dashboards
What Is a Quality Control Dashboard and Why It’s Important
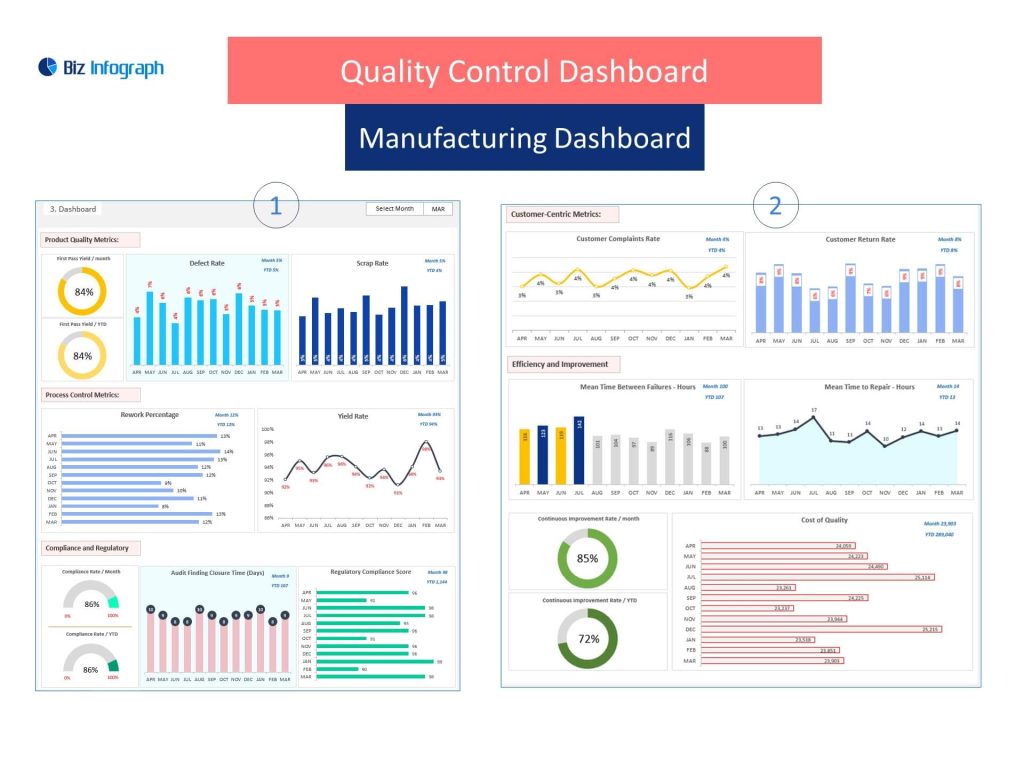
A quality control dashboard is a visual tool that tracks and displays quality metrics, offering a clear view into product quality, service quality, and data quality issues across an organization. The dashboard provides insights from real-time data, allowing teams to identify trends, anomalies, and potential quality issues before they escalate. These dashboards are essential in industries like manufacturing, healthcare, and finance, where adherence to quality standards is non-negotiable. By integrating data from various sources, the dashboard gives a comprehensive view of data and overall quality. Whether it’s improving manufacturing quality or maintaining data integrity, quality dashboards serve a vital function in modern operations.
Difference Between Quality Assurance and Quality Control Dashboards
While often used interchangeably, quality assurance and quality control dashboards serve distinct purposes. A quality assurance dashboard focuses on proactive measures to ensure data or product quality meets predefined standards—often by monitoring quality dimensions like accuracy, completeness, and consistency. In contrast, control dashboards are reactive tools designed to catch quality issues before they occur, relying on real-time data and alerts. QA dashboards aim for continuous quality improvement, whereas QC dashboards address deviations and compliance failures. Both types play a crucial role in a robust quality management system, but their scope and timing within the approach to quality management differ significantly.
Key Metrics Used in a Quality Dashboard
Effective quality dashboards rely on well-defined quality KPIs to track and measure quality across operations. Common quality metrics include defect rate, first-pass yield, return rate, and data quality metrics like accuracy, completeness, and timeliness. A quality KPI dashboard might also include trend lines to monitor changes in production quality or data quality over time. These KPIs help organizations maintain a culture of quality, detect data quality problems, and promote transparency. The right mix of quality KPIs enables businesses to assess performance, address weaknesses, and forecast potential quality issues, making data-driven decisions part of their everyday operations.
Implementing Quality Dashboards for Better Monitoring
How a Dashboard Provides Real-Time Product and Service Quality Insights
A modern quality dashboard is a visual interface that displays real-time data from critical systems to offer actionable insights into product quality and service quality. With access to the latest data, teams can monitor data and catch emerging issues before they affect customers. Dashboards can be configured to track various quality dimensions, from inspection outcomes to customer satisfaction metrics. By integrating multiple data points, businesses gain a clearer view of data related to quality, empowering departments like QA, engineering, and operations to respond quickly. These dashboards improve data quality, reduce errors, and ensure consistent quality across all output.
Steps for Quality Control Dashboard Implementation
Dashboard implementation begins with identifying the organization’s data quality needs and quality challenges. The next step is selecting the appropriate type of dashboard—whether for manufacturing quality, data operations, or customer service. Once goals and KPIs are defined, organizations must gather data from various sources, assess its integrity, and establish data governance protocols. After designing the quality dashboard template, visualization tools are used to build the dashboard interface. Throughout the process, collaboration between data teams, QA personnel, and business leaders is essential. Post-deployment, ongoing training and data monitoring ensure the dashboard continues to serve its role in effective quality management.
Dashboards for Quality Management in Manufacturing and Services
Whether in production lines or service delivery, dashboards for quality offer measurable benefits in quality management. In manufacturing, these dashboards help monitor data related to defects, batch performance, and production quality. In service environments, they track response times, SLA compliance, and service quality indicators. A well-implemented management dashboard unifies quality KPIs across the organization, breaking down silos and aligning everyone around shared quality objectives. The dashboard can be integrated into broader business intelligence (BI) systems, allowing for deeper exploration of complex quality trends. The result is a scalable tool for driving quality improvement across different departments and processes.
Improving and Managing Quality Through Dashboards
Using Control Dashboards for Ongoing Quality Improvement
Control dashboards are instrumental in sustaining quality improvement initiatives. They enable businesses to monitor data continuously and identify deviations from quality standards in real time. By flagging abnormal patterns or exceeding tolerance thresholds, these dashboards empower teams to act before minor problems evolve into significant failures. A dashboard serves as a control tower, providing consistent feedback loops that support lean and Six Sigma initiatives. It also helps track the impact of changes and measure the success of corrective actions. Ultimately, control dashboards promote operational excellence by making quality monitoring proactive rather than reactive.
How to Monitor Data and Ensure Critical Data Integrity
Data quality dashboards are crucial for organizations dealing with critical data across systems. These dashboards allow data engineers and analysts to detect data quality issues, such as duplication, null values, or inconsistent formatting. By using data quality metrics tied to fundamental quality dimensions—accuracy, completeness, consistency, and timeliness—teams can ensure their quality framework is solid. Dashboards also play a key role in supporting data governance policies by enabling continuous data monitoring and documentation. An effective data quality dashboard not only highlights problems but provides insights into the root causes, allowing teams to address data quality issues efficiently and maintain trust in the system.
Integrating Quality Dashboards into a Broader Management Dashboard System
A standalone quality assurance dashboard is powerful, but when embedded within a broader management dashboard, its effectiveness multiplies. Integration enables organizations to link quality KPIs with other business indicators such as production efficiency, customer satisfaction, and financial performance. This synergy enhances the approach to quality by showing how quality issues impact broader business outcomes. These unified dashboards can be tailored by department or role, providing targeted insights to executives, QA teams, and production managers alike. The result is a cohesive decision-support system that fosters alignment, accelerates root cause analysis, and strengthens a company’s culture of quality.
The Future of Quality Management Dashboards
Trends in Quality Assurance Dashboards and Analytics
As businesses move toward digital transformation, quality dashboards are evolving with enhanced automation, predictive analytics, and artificial intelligence. These advanced dashboards can now forecast potential quality issues, recommend corrective actions, and learn from past trends to optimize quality outcomes. Tools powered by AI can analyze complex data sets and deliver real-time suggestions to improve data quality and production quality. Cloud-based dashboard implementation is also gaining traction, offering scalability and accessibility from anywhere. The future points to more intelligent dashboards that not only monitor data but actively participate in quality management systems through autonomous decision-making.
Role of Data Quality Dashboards in the Digital Era
In the era of big data and digital platforms, data quality dashboards are indispensable. As companies rely on data for every strategic move, the need to ensure data quality is more pressing than ever. These dashboards help organizations trust in their data by exposing data source quality problems and promoting transparency. By standardizing the measurement of quality dimensions like completeness and accuracy, businesses can tackle data quality challenges systematically. Integration with cloud BI tools and real-time alerts ensures organizations stay agile and responsive. In short, these dashboards play a key role in ensuring data integrity and compliance in a digital-first world.
The Evolving Role of Dashboards in Quality Management Systems
The future of quality lies in more interconnected and intelligent systems. Dashboards are becoming the central hub of quality management systems, serving as a real-time command center for decision-making, compliance tracking, and continuous improvement. With growing complexity in products and processes, the need for dashboards for quality across departments is more vital than ever. Whether you’re dealing with data quality issues or manufacturing quality, dashboards help make data actionable and transparent. Organizations adopting such systems can better manage risk, reduce costs, and improve their overall approach to quality management, leading to more competitive and resilient operations.
For ready-to-use Dashboard Templates: