Why Operations Analytics Dashboards Matter in Pharma
How pharma dashboards improve operational visibility
In the pharmaceutical industry, operational complexity is high: strict regulatory compliance, sensitive product handling, long supply cycles, and large-scale production. A strong pharmaceutical analytics dashboard gives pharma organizations visibility into key performance areas by organizing large amounts of pharmaceutical data into one reliable data dashboard. Instead of searching through reports or manually combining spreadsheets, dashboards provide a single source for tracking pharma KPIs across manufacturing, supply chain, audits, and quality systems. With interactive dashboards, teams track the most critical operational metrics in real time and identify bottlenecks early. This is especially important in pharma companies where delays or non-compliance can lead to product shortages or regulatory action. Operations dashboards help pharmaceutical companies make informed operational decisions quickly and consistently.
Turning pharmaceutical data into actionable analytics
Pharma enterprises generate large amounts of data—batch production data, deviations, CAPA records, audit reports, trial metrics, clinical trial, and supply chain data. But without structure, pharmaceutical data remains raw and difficult to use. A dashboard transforms raw data into meaningful insights through data visualization, strong data modeling, and validated metrics. When dashboards provide real-time visibility, teams can detect patterns, identify and address issues, and improve production outcomes. Analytics tools help by transforming data into actionable recommendations: reduce deviations, improve OTIF performance, optimize stock levels, and track trial performance. Pharma companies must also validate data accuracy, because decisions rely on trustworthy information. When pharmaceutical organizations invest in embedded analytics and well-designed dashboards, they shift from reactive reporting to proactive management and better decision-making.
What Makes a Strong Pharmaceuticals Dashboard Template
Core pharma KPIs and metrics to include
A high-impact pharmaceutical dashboard template must focus on measurable pharmaceutical KPIs and operational metrics. Key KPIs include batch yield, cycle time, deviation rate, CAPA closure time, audit findings trend, OTIF delivery rate, inventory expiry risk, and supplier performance. Depending on the business area, dashboards should also track trial metrics such as enrollment rate, protocol deviations, and site performance. For commercial operations, track sales performance, customer data segmentation, and distribution fill rate. The goal is to create dashboards that allow pharma organizations to track KPIs like quality release delays, process efficiency, and supply disruptions. When predefine KPI definitions properly, teams track consistent metrics across departments. This improves informed decision-making, strengthens compliance, and enables continuous process improvement across pharma companies.
Dashboard structure, BI design, and visualization best practices
Dashboard structure is critical in pharma because users range from operators to compliance officers to executives. Dashboards should begin with summary KPI widgets (high-level metrics), then offer drill-down views by product, site, region, or time period. Strong BI design includes clean data visualization: trend lines, heatmaps, exception reports, and risk indicators. A good dashboarding design supports interactive dashboards that enable fast filtering. Most pharma organizations use Power BI or Tableau for pharma reporting. In both cases, data preparation and data modeling ensure the pharmaceuticals dashboard performance stays reliable even with large amounts of data. Best practice dashboards should also enable tablets and mobile access for field teams. When dashboards combine clarity with detail, pharma teams gain faster insights and can act quickly on quality or supply issues.
Manufacturing & Production Operations Dashboard
Production KPIs for pharmaceutical companies
Manufacturing operations in pharma require strict control and constant monitoring. A production dashboard focuses on batch processing performance, cycle time, yield variance, downtime, equipment utilization, and overall production throughput. For pharmaceutical companies, tracking these KPIs ensures consistent production output and supports the business goal of uninterrupted product availability. A production analytics dashboard helps teams track bottlenecks in production lines, identify recurring breakdown points, and monitor performance against manufacturing plans. With strong integration capabilities, dashboards can connect data sources from MES systems, ERP production modules, and quality systems. When dashboards provide production visibility into key areas, teams can optimize workflow and reduce batch completion delays. This supports faster operational execution and better decision-making under tight regulatory conditions.
Quality metrics and operational efficiency tracking
In pharma manufacturing, quality is not optional—it is the foundation. This dashboard template includes quality metrics such as deviation rate, non-conformance cases, reject counts, corrective action timelines, rework frequency, and quality release duration. These metrics help pharma organizations monitor regulatory compliance and ensure product safety. When dashboards provide real-time visibility into quality performance, teams can identify and address issues before they expand into larger compliance risks. Many pharma companies adopt embedded analytics so operators can act immediately rather than wait for monthly reports. Efficient dashboards also support continuous improvement by tracking improvements over time. With interactive dashboards, quality teams can investigate patterns and identify bottlenecks in batch release, inspection delays, or documentation gaps—leading to faster and safer manufacturing outcomes.
Inventory & Supply Chain Visibility Dashboard
Inventory KPIs for pharmaceutical industry performance
Pharma inventory management is more complex than typical industries due to cold chain requirements, expiry control, serialization, and regulatory documentation. This dashboard provides visibility into stock levels, expiry risk, inventory turnover, fill rate, stockout probability, and distribution cycle times. Pharma companies use these metrics to maintain continuous supply and reduce product waste. Supply chain data is often spread across systems—warehouse platforms, logistics tools, ERP systems, and third-party partners. A pharmaceutical analytics dashboard consolidates these data sources and provides operations teams one unified view. When teams track KPIs like near-expiry stock, warehouse aging, and replenishment delays, they can act proactively and improve service levels. This improves operational continuity and protects revenue.
Improving visibility across data sources and locations
Supply chain operations often involve multiple plants, regional warehouses, and global distribution channels. This dashboard template improves visibility by integrating data from different sources into a single data dashboard. Integration capabilities are critical—dashboards must pull data from multiple sources across server or cloud environments. Strong dashboards support filtering by plant, distribution center, customer zone, and product group. Dashboards also require strong data preparation, because supply chain data may contain incomplete fields or different naming standards. In pharma enterprises, ensuring accurate and consistent data is essential. When dashboards validate data and provide audit logs, they improve trust and governance. Ultimately, this template supports real-time visibility into key supply chain performance indicators and improves service delivery by reducing delays and preventing shortages.
Compliance, QA & Audit Analytics Dashboard
KPI dashboard for audits, CAPA, and deviations
Compliance dashboards are essential for regulatory compliance and risk management. This KPI dashboard focuses on audits, CAPA performance, deviation investigation timelines, recurring findings, and closure effectiveness. It allows pharma organizations to monitor key compliance indicators and manage inspection readiness. Strong dashboard examples include deviation trend charts, CAPA effectiveness scoring, and audit finding severity distribution. By tracking these KPIs, teams can identify bottlenecks such as delayed investigations or recurring issues in specific departments. This dashboard supports better decision-making because leadership can see whether compliance risk is improving or worsening. For high-security environments, dashboards require enterprise-grade security, SSO, and audit logs to ensure sensitive pharmaceutical data is protected and traceable.
Dashboard examples for compliance reporting and tracking
Pharma compliance reporting often involves multiple stakeholders: QA, manufacturing, regulatory affairs, and leadership. This dashboard template includes predefined compliance reporting sections, making it easier to present structured audit readiness results. Dashboard examples include “open vs closed deviations,” “CAPA aging analysis,” “inspection readiness score,” “audit schedule calendar,” and “compliance heatmaps by site.” Many pharma companies also embed analytics directly into quality systems so compliance reporting becomes faster. Self-service analytics ensures teams can explore compliance data independently without waiting for analysts. In large pharma enterprises, compliance dashboards must also support server or cloud deployment and mobile access to enable fast review during audits. When dashboards provide consistent compliance insights, pharma organizations make informed choices and strengthen inspection outcomes.
Executive Operations Analytics Dashboard
BI dashboard for leadership decision-making
Executive dashboards serve as the command center for leadership reporting. This BI dashboard consolidates manufacturing quality, supply chain service delivery, compliance health, and commercial outcomes into one unified view. It helps leaders make informed choices quickly, using visibility into key performance trends rather than relying on fragmented reporting. The executive dashboard includes KPIs such as OTIF, batch release cycle time, total deviations, audit risk score, and strategic supply status. It supports informed decision-making by connecting operational performance to business impact: missed deliveries, higher costs, or compliance risk. This is especially important in pharma organizations managing multiple plants and supply regions. A strong executive dashboard allows leadership to spot risks early and allocate resources proactively.
Leveraging Power BI for pharmaceutical analytics dashboards
Power BI is widely used for pharma dashboards due to its integration capabilities, interactive dashboards, and strong enterprise-grade security options. With Microsoft Power BI, teams can connect data sources like databases, cloud warehouses, spreadsheets, and quality systems. It supports structured data modeling and offers dashboard templates that can be customized for different pharma units. Power BI also supports self-service analytics, meaning users and data teams can collaborate on dashboards without heavy technical dependence. For regulated environments, Power BI supports security features like SSO, access roles, and audit logs. Many pharma companies use Power BI embedded analytics, allowing dashboards to be displayed inside internal portals. When pharma organizations leverage Power BI effectively, they can transform data into actionable insights and create compelling data stories that support operational and strategic decision-making.
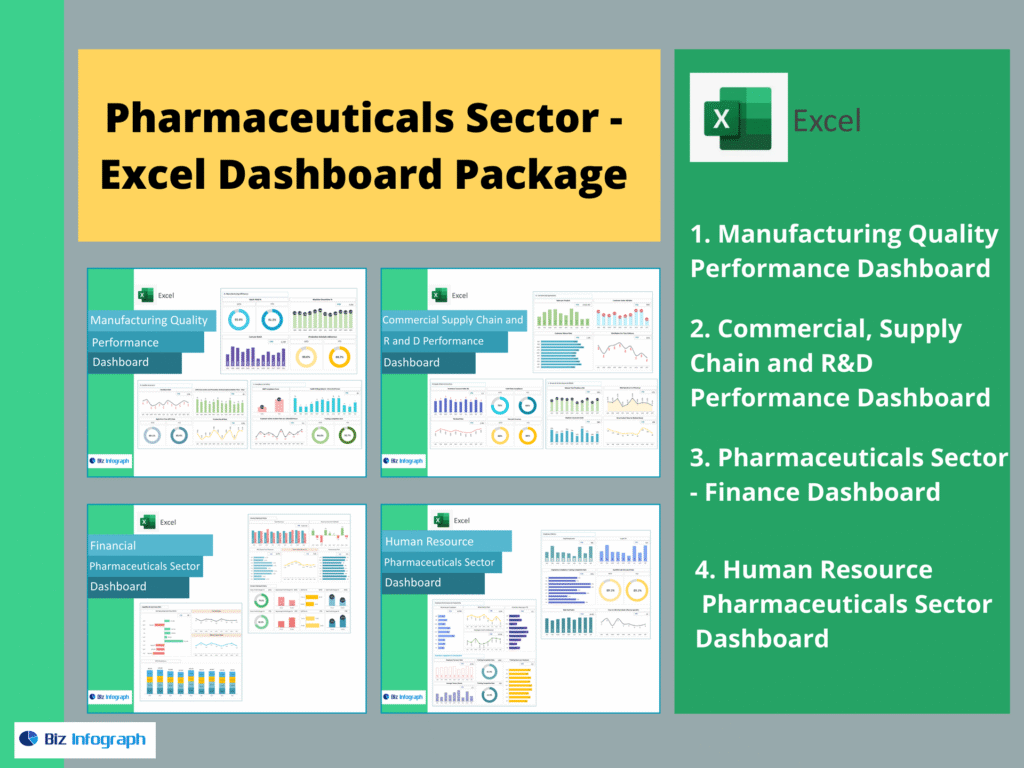
The 4 Dashboards Included in This Pharma Package
A complete operational dashboard package for pharma enterprises should include: Manufacturing Quality Performance Dashboard, Commercial, Supply Chain and R&D Performance Dashboard, Pharmaceuticals Sector – Finance Dashboard, and Human Resource Pharmaceuticals Sector Dashboard. Together, these templates provide end-to-end operational visibility—from manufacturing quality and supply chain performance to financial control and workforce capacity. With enterprise-grade security, integration capabilities, and validated pharmaceutical data, these dashboards enable pharma organizations to make informed decisions faster and improve compliance, performance, and service outcomes.
For ready-to-use Dashboard Templates: