Understanding Overall Equipment Effectiveness (OEE)
What Is OEE and Why It Matters in Manufacturing
Overall Equipment Effectiveness (OEE) is a critical metric that measures how efficiently manufacturing operations are performed. It evaluates the percentage of production time that is truly productive, considering availability, performance, and quality. Measuring OEE helps manufacturers identify losses across their production process and drive continuous improvement. OEE is not just a number—it’s a key performance benchmark that reveals the overall performance of equipment, operators, and production lines. As a metric for identifying losses, OEE supports initiatives in improving performance, maximizing equipment utilization, and boosting manufacturing productivity across the plant floor.
Key Metrics That Make Up Overall Equipment Effectiveness
The OEE score is built on three core components: Availability, Performance, and Quality. Each of these components reflects a distinct area of potential production loss. Availability accounts for equipment downtime, Performance looks at machine performance and speed losses, while Quality considers defective units. Together, they provide a full view of how effective a piece of equipment is during its scheduled runtime. These performance metrics help manufacturers identify areas for improvement and systematically improve the manufacturing process by focusing on root causes and not just symptoms. Monitoring these metrics enables plant managers to lead with precision.
How to Track OEE for Manufacturing Productivity
Tracking OEE involves collecting accurate, real-time data from machines and consolidating it through dashboards and reports. Today’s OEE capabilities allow for the automation of data capture using sensors and software. Modern systems capture OEE and translate raw signals into understandable metrics that reflect production performance by shift, machine, or operator. These dashboards are designed to track changes over time, highlighting shift progress and revealing low OEE patterns. Leveraging these insights empowers manufacturers to monitor equipment efficiency, boost productivity, and reduce bottlenecks throughout the production process.
Exploring the OEE Dashboard
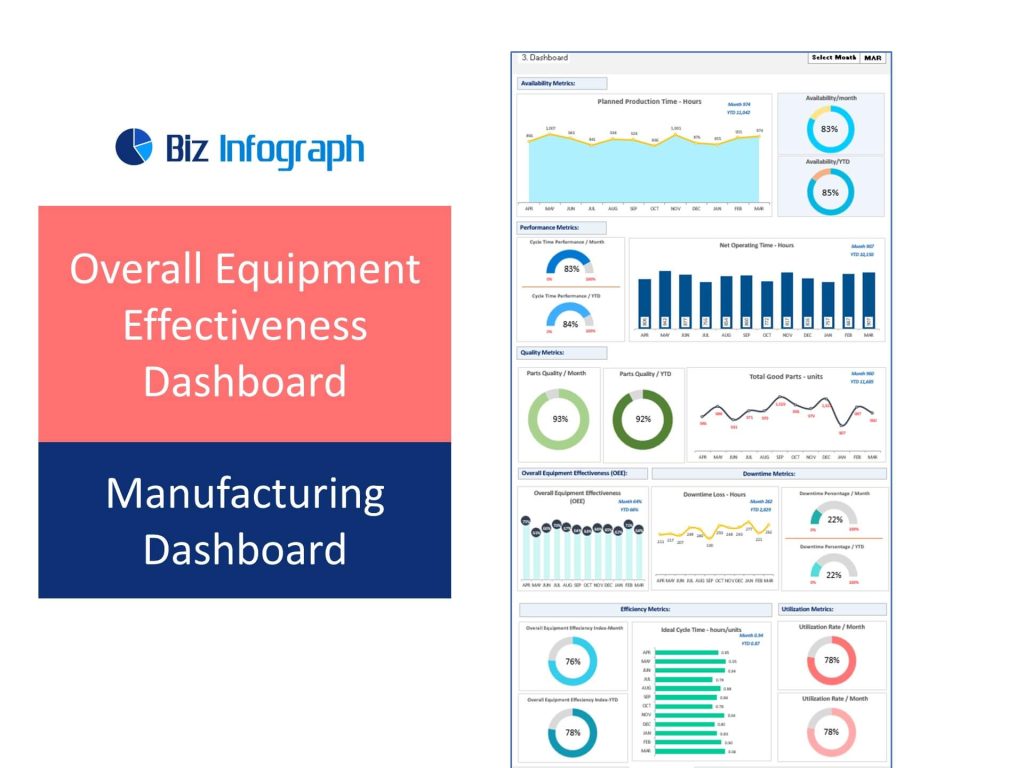
What Is an OEE Dashboard and Its Core Capabilities
An OEE dashboard is a custom dashboard that displays real-time OEE scores and related production metrics in one centralized interface. These dashboards allow supervisors and operators to quickly evaluate equipment efficiency and make timely decisions. A well-designed overall equipment effectiveness dashboard aggregates data from machines, evaluates key production KPIs, and supports informed decision-making. Some dashboards go beyond the basics and allow users to analyze effectiveness between operators, shifts, or machine lines. By incorporating real-time insights, OEE dashboards provide the visibility needed to assess performance quickly and act accordingly.
Visualize Production Efficiency with Real-Time Dashboards
The ability to visualize production efficiency is essential for plant managers and upper management. An OEE manufacturing dashboard offers a graphical representation of the time that is truly productive vs. losses due to downtime or inefficiencies. Dashboards offering real-time updates improve visibility across the shop floor, highlighting variances in shift or machine performance. OEE data provides visual indicators that can be used to identify areas for improvement or detect anomalies early. As real-time insights evolve, dashboards and reports become even more powerful for process improvement and boosting productivity.
How OEE Dashboards Support Informed Decision-Making
OEE dashboards are essential tools in supporting informed decision-making. By consolidating production data into digestible visuals, they help plant managers, operators, and executives spot inefficiencies and act quickly. Dashboards allow users to view trends, compare performance across shifts or lines, and drill down into detailed insights that improve business intelligence. With access to real-time OEE scores, management can prioritize investments, allocate resources better, and deploy corrective actions more confidently. The OEE dashboard becomes a central hub for strategic planning and daily operations alike, enabling everyone to make data-driven decisions.
Metrics and KPIs to Monitor with an OEE Dashboard
Top OEE KPIs to Improve Production Efficiency
Monitoring key production KPIs through your OEE dashboard is critical for enhancing overall efficiency. These KPIs often include availability rate, performance rate, quality rate, and the combined OEE score. Additional KPIs may involve equipment utilization, production performance by shift, or even analyze effectiveness between operators. These insights help identify areas for improvement and flag recurring issues like low OEE. By consistently reviewing these performance metrics, organizations can set better benchmarks, align teams across departments, and drive continuous improvement initiatives that enhance manufacturing productivity.
Using Analytics to Understand and Improve OEE
Leveraging analytics within the overall equipment effectiveness dashboard allows manufacturers to move beyond surface-level observations. Data gathered from various data sources on the plant floor provides a holistic view of production performance, which can be segmented by shift, operator, or machine. These insights allow for process improvement by pinpointing exactly where productivity dips are occurring. Integrating this into your business intelligence or BI strategy turns OEE from a lagging indicator into a predictive one—empowering teams to take preventive action before losses become systemic.
Tracking Production Data for Better Business Intelligence
Your OEE system serves as a vital component of your broader business intelligence infrastructure. Tracking production data in real time enables organizations to build historical trends, forecast future performance, and understand production behaviors more deeply. This OEE data provides not just operational context but strategic insights that guide capacity planning, maintenance scheduling, and workforce management. Dashboards and reports help ensure that data facilitates better communication among stakeholders, aligning goals and improving coordination between workers and managers. As a result, OEE becomes a catalyst for data-driven decision-making across the organization.
Enhancing Productivity Through OEE Dashboards
Leveraging Real-Time Insights to Optimize Performance
OEE dashboards that offer real-time insights empower manufacturers to optimize performance continuously. Real-time monitoring of equipment efficiency and shift progress ensures that any deviations from expected output are caught early. These dashboards allow supervisors to act quickly, whether by reallocating labor, addressing maintenance issues, or rescheduling jobs. Real-time OEE scores help manufacturers identify areas for improvement instantly, making the production process more responsive and efficient. With such tools in place, teams can make data-driven decisions that improve outcomes without waiting for end-of-day reports.
Aligning OEE Dashboards with Operational Goals
To be most effective, an OEE dashboard must be aligned with operational objectives such as reducing downtime, increasing throughput, and maintaining high-quality standards. Organizations can customize their dashboards and reports to focus on key production areas aligned with these goals. When OEE dashboards reflect strategic objectives, they transform from reporting tools into execution engines. They provide actionable insights that ensure efforts on the plant floor directly contribute to organizational KPI. This alignment strengthens accountability and sharpens focus on what matters most: delivering consistent value and improving operational efficiency.
Building a Culture of Continuous Improvement Using OEE Metrics
Adopting an overall equipment effectiveness dashboard supports the development of a culture rooted in continuous improvement. By making performance data transparent and available to all levels of staff, it facilitates better communication among workers and managers. Operators become more engaged when they understand how their actions affect machine performance and the OEE score. Meanwhile, leadership uses these actionable insights to remove roadblocks and implement meaningful changes. With consistent feedback loops and visibility into real results, teams become motivated to hit performance targets and sustain gains, thereby creating lasting improvements in manufacturing productivity.
For ready-to-use Dashboard Templates: