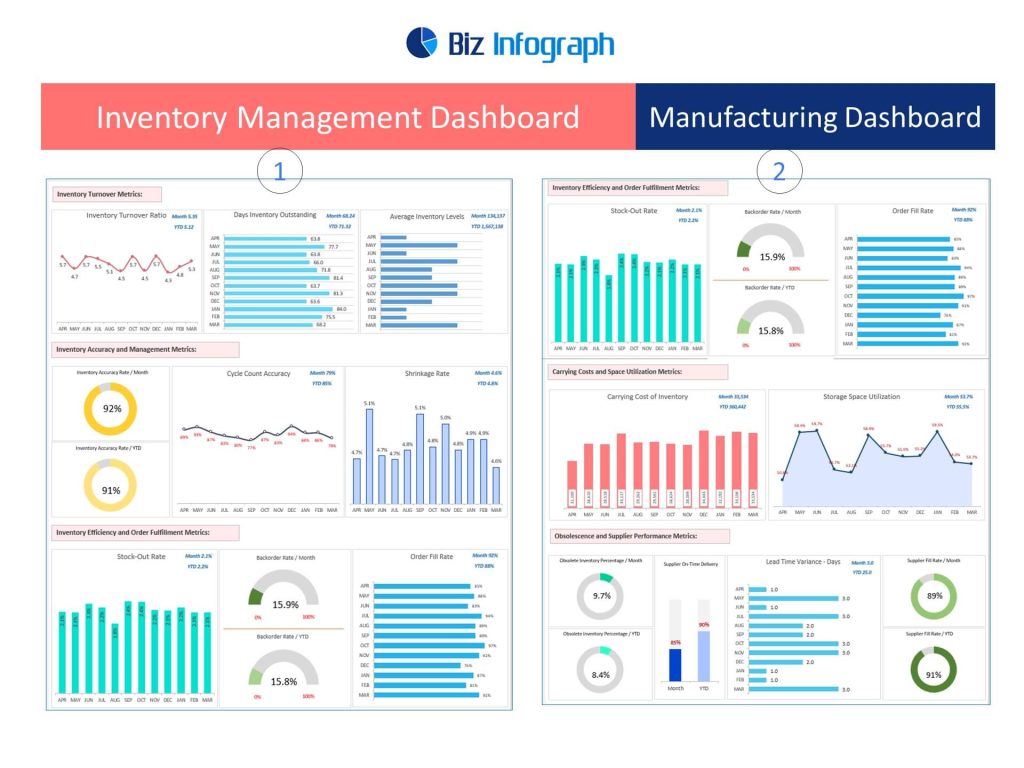
Introduction to Inventory Management Dashboards
What Is an Inventory Dashboard and Why It’s Essential
An inventory dashboard is a visual analytics tool designed to give businesses a clear overview of their inventory levels, movements, and trends. Whether you’re managing a warehouse, retail store, or supply chain, an inventory management dashboard provides actionable insights into stock availability, reorder points, stockouts, and overstock situations. Dashboards consolidate data from multiple sources into a single, user-friendly interface, helping teams monitor inventory in real time and make quick decisions. By using an inventory dashboard, businesses can optimize their storage, reduce holding costs, and prevent disruptions due to inventory imbalances. It’s an essential component of modern inventory control systems.
Overview of Inventory KPIs to Track
A successful inventory KPI dashboard is driven by the right set of key performance indicators (KPIs). These include inventory turnover rate, carrying cost of inventory, stockout rate, average days to sell inventory, and reorder frequency. Tracking these metrics helps teams evaluate the effectiveness of inventory strategies, spot inefficiencies, and maintain optimal stock levels. The dashboard typically uses tables and visuals to represent these KPIs in a digestible format. By having a clear overview of these metrics, businesses can ensure consistent product availability, avoid excess inventory, and improve customer satisfaction. Effective use of KPIs is what turns raw data into performance-enhancing insights.
Benefits of Using a Real-Time Inventory Dashboard
One of the major advantages of using a real-time inventory dashboard is the ability to react instantly to inventory changes. Instead of relying on periodic reports, businesses gain up-to-the-minute visibility into their stock levels and warehouse activities. This real-time access helps prevent stockouts, reduce lead times, and improve decision-making accuracy. Real-time dashboards often include alerts for low stock, incoming shipments, or inventory discrepancies. A real-time dashboard promotes agility and responsiveness, both of which are crucial in today’s fast-moving supply chain environments. Whether embedded in an ERP system or as a standalone tool, real-time dashboards elevate operational efficiency.
Key Components of an Inventory Dashboard
Common Tables and Visual Elements in an Inventory KPI Dashboard
An effective inventory dashboard includes a combination of tables, charts, and visual indicators to provide a well-rounded picture of inventory health. Common tables may display SKU details, quantity on hand, reorder levels, backorders, and supplier lead times. These tables can be sorted or filtered to provide focused views by location, category, or vendor. Alongside tables, dashboards feature charts showing stock trends, turnover rates, and inventory aging. The combination of visuals and data tables makes it easier to digest complex data at a glance. This design helps ensure that managers and teams can access actionable insights quickly and clearly.
Real-Time Features That Enhance Inventory Monitoring
The best inventory management dashboards incorporate real-time features to enhance accuracy and responsiveness. Real-time syncing with inventory systems allows for immediate updates on stock levels, inbound or outbound shipments, and stock transfers between locations. This enables businesses to track fluctuations instantly and respond proactively. For instance, if an item reaches its reorder point, the dashboard can trigger an alert or reorder suggestion automatically. Real-time capabilities also ensure that multiple departments (procurement, sales, logistics) are working from the same data set, improving coordination and minimizing delays. Real-time inventory dashboards turn passive reporting into active inventory control.
Inventory Dashboard Examples for Different Business Needs
There are various inventory dashboard examples tailored to specific industries and business models. A retail-focused dashboard may emphasize product performance and shrinkage, while a manufacturing dashboard might focus on raw materials, WIP (work in progress), and fulfillment timelines. For e-commerce, dashboards often track multi-location inventory, return rates, and SKU velocity. These dashboard examples highlight how different operational goals require different sets of KPIs and visualizations. By reviewing and adapting from proven dashboard templates, businesses can accelerate implementation and ensure that their dashboards are designed for the specific challenges they face in managing inventory.
Building and Customizing an Inventory Dashboard
How to Build an Inventory Dashboard from a Template
Using an inventory dashboard template is one of the most efficient ways to build a functional dashboard. Templates typically come with pre-built layouts for key metrics such as stock levels, restock alerts, aging inventory, and vendor performance. These templates can be customized by linking them to your business’s live inventory data, often through Excel, Power BI, or ERP systems. Building from a template allows users to skip the groundwork and focus on adding unique business-specific requirements. Whether you use a cloud-based platform or a spreadsheet tool, templates help accelerate deployment while ensuring professional, accurate results.
Best Practices to Create an Effective KPI Dashboard
Creating a high-impact KPI dashboard requires a focus on clarity, consistency, and relevance. First, select KPIs that align with business objectives—such as minimizing stockouts or improving turnover. Avoid cluttering the dashboard with too many metrics; instead, focus on a few high-impact indicators. Use visual hierarchy: place critical KPIs at the top and use charts to highlight trends or alerts. Include color-coded indicators (green for healthy, red for warning) to draw attention. Make sure data updates automatically and that the layout is easy to interpret. A good dashboard should help users identify issues at a glance and take action swiftly.
Customizing Inventory Dashboards for Operational Insights
Every business has unique inventory challenges, which is why customizing an inventory dashboard is vital for maximizing its impact. Customization involves selecting which KPIs to display, adjusting date ranges, segmenting by product categories, or integrating data from multiple warehouses. You can also customize the layout to match user preferences—such as role-specific views for warehouse staff, procurement teams, or finance managers. Custom dashboards make it easier to build targeted reports and perform advanced analysis. By customizing dashboards, businesses gain more relevant insights, uncover hidden inefficiencies, and make smarter inventory decisions with confidence.
For ready-to-use Dashboard Templates: