Why Hospitality And Tourism Dashboards Matter for Tourism Analytics
How a hospitality dashboard supports hospitality business decisions
In the fast-paced hospitality industry, decisions must be made quickly and accurately—often daily. A hospitality dashboard serves as a centralized business dashboard that collects hospitality data and presents it in a clear, visual format. Instead of relying on scattered spreadsheets or delayed reports, a dashboard provides real-time insights into occupancy rate, current occupancy, booking trends, cancellations, and total revenue. This creates a data-driven and datadriven environment where hotel managers can see key performance indicators instantly and act faster. For example, if cancellation rate increases or length of stay declines, a dashboard helps detect the pattern early. Whether using a dashboard in Excel or Power BI, dashboards improve property management, revenue management, and daily operations in hospitality business settings.
Dashboard reporting benefits for tourism dashboard package users
A tourism dashboard package is valuable because it standardizes analytics and reporting across multiple tourism and hospitality operations. For hotels, resorts, short-term rental operators, and travel service providers, a dashboard provides consistent performance metrics and gives hotel managers an easy way to interpret results. Dashboards support faster data analysis, stronger revenue analysis, and better tracking of key metrics like ADR, RevPAR, total bookings, and average length of stay. A high-quality dashboard helps hospitality teams monitor customer behavior across booking channels and respond to shifting demand. For hotel chains managing multiple properties, dashboards can consolidate hospitality data from each location. Ultimately, a tourism dashboard package improves reporting accuracy and provides key insights that help hospitality teams optimize pricing, manage staffing, and increase guest satisfaction.
What Makes a Great Hospitality Dashboard Template
Must-have key metrics and hospitality analytics
A strong hospitality analytics dashboard begins with choosing the right key metrics. The dashboard template should focus on actionable key performance indicators, including occupancy rate, ADR, RevPAR, total bookings, cancellation rate, and total revenue. It should also include guest satisfaction signals such as room service ratings, response time, and complaint resolution. In tourism analytics, dashboards should include booking source breakdowns and customer behavior insights: direct bookings vs OTAs, booking lead time, and conversion trends. The best dashboards are data-driven and designed to show performance metrics clearly, not overload users with unnecessary charts. A dashboard provides the advantage of combining operational and financial metrics in one place. Whether built in Excel or Power BI, hospitality analytics dashboards must support fast decisions for hotel management and revenue management teams.
Dashboard layout and business dashboard design tips
Dashboard design matters as much as the data. A dashboard template must be structured so users can scan it quickly. Typically, the top row should contain KPI widgets (a widget set) summarizing occupancy, ADR, RevPAR, total revenue, and total bookings. Next, include trend charts for booking trends, revenue analysis, and current occupancy. A good data visualization layout includes filters for property, date range, booking channel, and customer segment. This is where customization becomes important—dashboards should be customizable and ideally fully customizable. Hospitality businesses vary by size and model: boutique hotels, hotel chains, and short-term rental operators need different reporting views. The best dashboard helps hospitality managers move from overview to deeper analysis in seconds. For scalable templates, Power BI dashboards are ideal because they support drill-downs and real-time refresh from connected data sources.
Revenue & Booking Performance Dashboard
Track key metrics like bookings, ADR, RevPAR
The first and most essential template is the Hospitality & Tourism Finance Dashboard, often called a revenue and booking performance dashboard. This hotel management dashboard focuses on core hospitality metrics such as total bookings, ADR (Average Daily Rate), and RevPAR (Revenue per Available Room). These are the most critical key metrics used in hotel performance evaluation. A dashboard helps hospitality leaders track revenue management outcomes by showing total revenue, average length of stay (avg), booking trends, and cancellation rate. When these performance metrics are tracked consistently, hospitality businesses can identify which booking channels deliver the best results. This dashboard template works well as a dashboard in Excel for small properties and also scales well in Power BI for hotel chains needing deep analytics and automated reports.
Revenue trends and occupancy insights for hospitality business
Revenue performance is not just about total revenue—it’s about understanding why revenue changes happen. A well-built dashboard provides revenue analysis using charts and widgets that highlight sales movements, occupancy shifts, and pricing impacts. For example, if occupancy rate rises but ADR falls, it may signal aggressive discounting. If ADR rises but occupancy drops, marketing campaigns may need adjustment. This type of data analytics transforms hospitality data into key insights. The template should show revenue trends by week/month, property performance comparisons, and channel contribution. Hospitality businesses can use this dashboard to manage pricing strategy, optimize room availability, and improve forecasting. In a competitive tourism market, these insights support smarter decisions and long-term growth.
Guest Experience & Service Metrics Dashboard
Guest satisfaction scores and service quality metrics
The second dashboard is the Hotel Operations and Guest Experience Dashboard. While finance dashboards track results, guest dashboards track experience—because guest satisfaction is the foundation of repeat bookings and long-term hotel performance. This hospitality analytics dashboard monitors key service performance metrics such as guest satisfaction ratings, review scores, complaint categories, room service delivery time, housekeeping response, and incident resolution. In a fast-paced hospitality industry, operational visibility helps hospitality teams respond quickly. A dashboard provides real-time insights that highlight service bottlenecks before they harm brand reputation. The best dashboard template also allows filtering by room type, department, and shift timing. With clear data visualization and widgets, hotel managers can track service levels daily and ensure consistent guest experience across properties.
Insights for improving reviews and repeat bookings
Guest experience dashboards are powerful because they connect customer behavior with operational performance. When guests leave poor reviews, it’s often tied to response time, cleanliness, delayed room service, or check-in issues. A guest experience dashboard helps hospitality teams identify patterns in guest feedback and take corrective actions. For example, if complaints spike on weekends, staffing may need adjustment. If certain floors show more complaints, maintenance audits may be required. These insights also help hospitality businesses improve repeat bookings, which is critical for reducing reliance on paid marketing. A tourism dashboard package becomes more complete when it includes guest insights, not only finance. By staying data-driven, hospitality business owners can improve customer experience and create sustainable growth through reputation, loyalty, and higher occupancy.
Digital Marketing & Demand Analytics Dashboard
Google Analytics metrics for tourism and hospitality
The third dashboard template focuses on demand generation: the Tourism and Travel Services Efficiency Dashboard or hospitality marketing dashboard. This dashboard integrates Google Analytics data to measure website performance, booking funnel behavior, and channel performance. It tracks tourism-related customer behavior such as traffic sources, landing page engagement, booking click-through rates, and conversion. The best dashboard template includes Google Analytics KPIs like sessions, users, bounce rate, conversion events, and revenue by source. In hospitality business strategy, this dashboard helps hotel marketers understand which pages or campaigns are driving bookings. Whether using Power BI or Excel dashboard tools, integrating hospitality data with digital analytics is key for becoming truly data-driven and competitive.
Digital marketing KPIs using marketing tools
A strong marketing dashboard measures performance metrics such as cost per booking, return on ad spend, and conversion rate by campaign. It supports hotel marketers by tracking marketing efforts across channels: Google Ads, Meta, influencer partnerships, and email marketing tools. The dashboard provides key insights into marketing campaign performance, enabling better budget allocation. For example, if one campaign increases traffic but not total bookings, messaging or audience targeting may need changes. This is how dashboards help hospitality businesses boost demand while controlling costs. In a tourism dashboard package, this template is essential because it turns marketing data into actionable strategy. By combining hospitality analytics dashboard design with customizable filters, the dashboard becomes fully customizable for different properties, seasons, and target guests.
Short-Term Rental Performance Dashboard
Analytics and metrics for Airbnb/VRBO style rentals
Short-term rentals are now a major part of tourism. The fourth template is designed for this market segment and works as a short-term rental performance dashboard. It tracks occupancy rate, nightly rate trends, total bookings, cancellation rate, length of stay, and guest satisfaction—similar to hotels, but with rental-specific performance indicators. This dashboard template supports e-commerce style analytics because rentals often operate across multiple booking channels. Hospitality businesses managing rental portfolios need clear data sources and structured reporting. Dashboards can accept CSV files, imported from property management systems, and combine them into one view. For operators, this dashboard helps ensure pricing stays competitive, occupancy remains strong, and customer satisfaction remains consistent.
Business dashboard for maximizing rental profitability
Short-term rental profitability depends on both revenue and efficiency. A dashboard provides insights into total revenue, cleaning costs, maintenance expenses, booking trends, and pricing strategy. It supports revenue management by identifying when to raise or lower rates based on demand signals. A fully customizable dashboard allows filtering by property type, city, season, and booking source. With Power BI, dashboards can refresh automatically from connected data sources; in dashboard in Excel, operators can upload updated csv files weekly. The template becomes a dashboard solution that gives hotel managers and rental operators real-time insights into performance. For tourism businesses aiming to scale, this dashboard helps hospitality teams maximize profitability while maintaining service standards.
How to Choose the Right Tourism Dashboard Package
Choosing the right dashboard template for your hospitality business
Choosing the right dashboard starts with clarity on your business model. A boutique hotel may prioritize guest experience dashboards, while large hotel chains may focus on finance dashboards and standardized KPI reporting. Short-term rental operators often need customizable dashboards that consolidate multiple properties. The best tourism dashboard package includes multiple dashboards that cover finance, operations, marketing, and HR. When selecting a dashboard template, ensure it supports your data sources—Google Analytics, booking platforms, property management systems, and csv files. For scalable analytics, Power BI is ideal; for simpler use cases, dashboard in Excel works well. A dashboard tool should match your team’s capability and speed of decision-making needs. Ultimately, choosing the right dashboard ensures your hospitality data becomes useful, consistent, and actionable.
Matching dashboards to your goals and key metrics
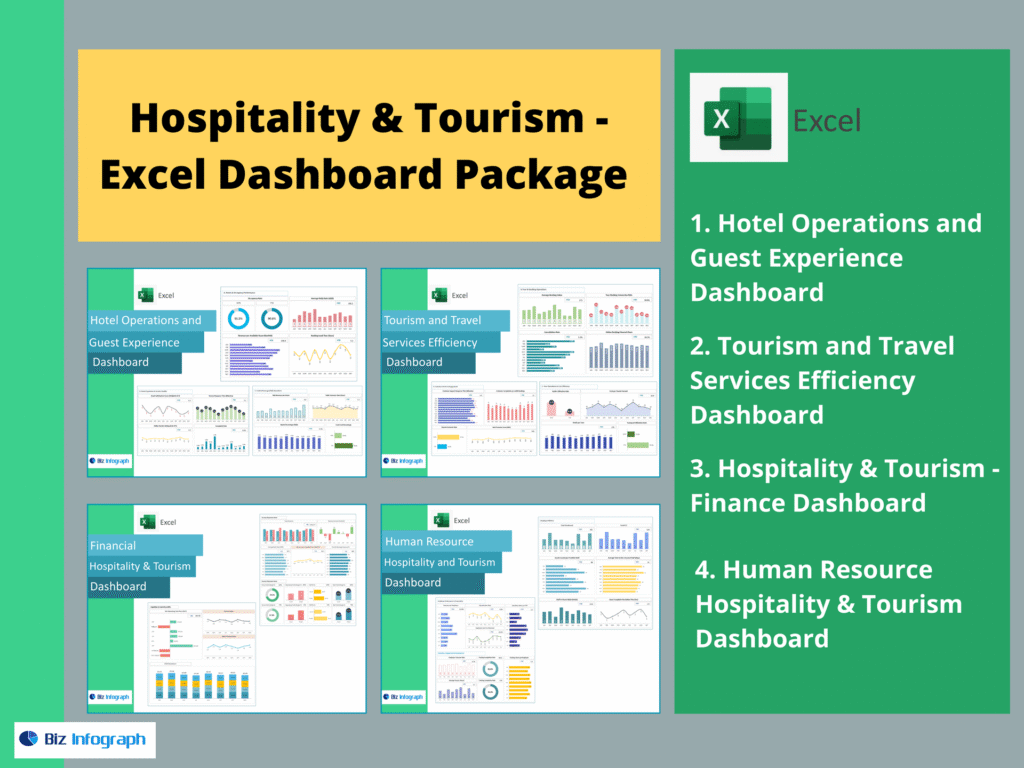
Different hospitality goals require different dashboards. If your goal is revenue growth, focus on key metrics like ADR, RevPAR, total bookings, and total revenue. If your goal is reputation and loyalty, focus on guest satisfaction dashboards and service performance indicators. If your goal is demand growth, prioritize marketing dashboards and analytics that show customer behavior, conversion rate, and channel performance. If your goal is operational efficiency, dashboards should highlight staffing, housekeeping, room service, and property management KPIs. This is why a complete Hospitality & Tourism Dashboard Package should include the following four dashboards in writing:
- Hotel Operations and Guest Experience Dashboard
- Tourism and Travel Services Efficiency Dashboard
- Hospitality & Tourism Finance Dashboard
- Human Resource Hospitality & Tourism Dashboard
When these dashboards work together, hospitality businesses gain real-time insights and a data-driven system for sustainable growth.
For ready-to-use Dashboard Templates: