Why FMCG Dashboard Package Matter for Sales Performance
How FMCG analytics dashboards improve sales decisions
In the fast-moving consumer goods (FMCG) industry, small changes in demand can create big operational challenges. An effective FMCG dashboard provides a single view of real-time sales, distribution performance, and product availability, helping FMCG managers act quickly. With an analytics dashboard, sales teams can monitor sales value, sales volume, and performance across distribution channels. This supports strategic decisions such as which product categories to prioritize, how to allocate inventory, and how to plan promotions. FMCG analytics dashboards are especially useful because they combine business data from retail, wholesalers, and e-commerce platforms into one view. When managers use tools like Power BI, dashboards provide real-time insights and enable data-driven decisions that improve performance and competitiveness in the FMCG industry.
Turning FMCG data analytics into key insights
FMCG businesses generate massive amounts of business data from customer data, retail scans, warehouse systems, and supply chain operations. Without a clear dashboard using structured data model design, teams struggle to interpret trends. FMCG data analytics becomes valuable only when transformed into key insights—such as which SKUs are driving growth, which regions show changing consumer behavior, and where stockouts are hurting sales performance. A dashboard allows decision-makers to spot areas needing improvement quickly and take immediate action. With real-time data and strong visualization, dashboards turn raw data into actionable insights, making it easier for FMCG teams to forecast demand, optimize stock levels, improve distribution planning, and implement data-driven strategies that increase market share.
What Makes a Strong FMCG Dashboard Template
Core FMCG sales KPIs to include
A strong FMCG dashboard template must focus on KPIs that matter most to FMCG business performance. These include sales value, sales volume, real-time sales growth, product portfolio performance, and channel contribution. FMCG managers also monitor SKU-level performance by product categories like personal care, food, beverages, and household items. In addition, dashboards should track distribution KPIs such as route performance, store coverage, order fulfillment, and OTIF (On Time In Full). By monitoring these metrics, FMCG teams can ensure consistent product availability and improve business operations. The best dashboard includes KPIs that support strategic decisions—helping decision-makers understand customer behavior, improve marketing activities, and align sales teams with performance targets.
Dashboard structure, visualization, and data model
A high-performing analytics dashboard depends on strong structure and a reliable data model. The dashboard should provide a quick snapshot first—top KPIs, product availability, distribution performance, and profit margins—then allow deeper analysis through drill-downs. Visualization matters: charts must highlight patterns like regional demand shifts, top-selling product categories, or declining inventory turnover. For Power BI dashboards, interactive filters and slicers improve usability for FMCG teams. Most importantly, the data model must connect data sources properly: sales data, warehouse stock levels, customer data, supply chain systems, and e-commerce reporting. With correct relationships and a clean data model, dashboards provide deep insights effectively and ensure decision-makers trust the numbers. This creates a true business intelligence reporting system with one view across operations.
FMCG Sales Performance Dashboard
Sales dashboard metrics for FMCG industry growth
The first template, the Sales and Distribution Performance Dashboard, is a core sales dashboard that drives FMCG industry growth. It tracks sales performance metrics like sales value, sales volume, market penetration, and growth rate across product portfolio and product categories. This dashboard helps FMCG managers monitor key insights such as which FMCG brands are growing, which regions show strong demand, and which distribution channels generate the highest revenue. It is especially valuable for decision-makers because it supports data-driven decisions to boost sales. When combined with customer data and consumer behavior patterns, the dashboard provides insights effectively to help teams improve marketing strategies and optimize promotions. In Power BI, this becomes a real-time analytics dashboard with fast filtering.
FMCG sales trends, region, and channel analysis
FMCG success depends on understanding sales trends by region, store type, and distribution channels. This dashboard template highlights regional demand patterns, channel-specific contribution, and performance by SKU or category. It helps FMCG teams detect shifting consumer behavior—such as increased demand in one city or growing orders through e-commerce platforms. A dashboard allows sales managers to compare real-time sales results across territories, identify areas needing improvement, and take corrective action quickly. It also supports better planning by highlighting underperforming distributors or retail partners. By combining data analytics with strong visualization, this sales dashboard becomes a critical business intelligence tool that enables FMCG business leaders to make informed decisions and strengthen distribution strategy.
Inventory Management & Warehouse Dashboard
Warehouse KPIs and inventory management analytics
The second template, the Production, Inventory and Supply Chain Dashboard, focuses on inventory management and warehouse operations. It tracks stock levels, inventory turnover, turnover rate, warehouse stock aging, and detailed inventory movement. FMCG companies depend heavily on product availability because consumers often switch brands when products are unavailable. This dashboard using Power BI or Excel provides a clear view of inventory levels across warehouses and distribution centers. It monitors key warehouse KPIs such as incoming stock, outgoing shipments, damaged goods rate, and picking efficiency. By integrating data sources from ERP, warehouse systems, and sales orders, the dashboard provides real-time insights that help FMCG managers optimize inventory management and ensure consistent product availability.
Preventing stockouts and reducing overstock
Stockouts and overstock are two of the biggest profit killers in the FMCG industry. The dashboard allows FMCG managers to monitor out-of-stock risk, identify stockouts early, and prevent lost revenue. It also detects overstock situations where slow-moving products tie up cash and warehouse space. Key metrics include safety stock levels, reorder triggers, forecast accuracy, and inventory turnover. This analytics dashboard supports data-driven strategies by showing which products are at risk based on real-time sales and regional demand. It also helps FMCG teams optimize replenishment planning and reduce waste. By turning data analytics into actionable insights, the dashboard enables better planning, improves supply chain performance, and supports stronger customer satisfaction through high product availability.
Pricing, Promotions & Profitability Dashboard
Promotion performance analytics dashboard metrics
FMCG brands rely heavily on promotions to drive sales volume, especially in personal care, beverages, and packaged goods. This dashboard template evaluates promotion performance using KPIs like uplift percentage, campaign ROI, price discount impact, sales value increase, and incremental profit margins. It helps FMCG managers identify which pricing strategies work best and which promotions create only temporary spikes without sustainable growth. By tracking distribution channels, the dashboard also measures whether promotions perform better in retail stores or e-commerce platforms. Combined with customer data, it helps decision-makers understand customer response patterns. With visualization and real-time data refresh, FMCG teams can monitor key metrics during campaigns and adjust quickly to improve marketing effectiveness and revenue outcomes.
Profitability insights using data analytics
In FMCG, profitability depends on margins, not just high sales volume. This dashboard provides profit margin tracking by product portfolio, product categories, and sales channels. It includes cost drivers like logistics expenses, production costs, warehousing, and promotion spending. FMCG sector managers use these insights to make smart decisions about pricing, product mix, and distribution allocation. The dashboard provides deep insights by connecting finance data with sales and supply chain performance. For example, one product may sell well but lose money due to heavy discounts or high shipping costs. Using business intelligence, this dashboard turns business data into actionable insights and shows where optimization is required—improving overall FMCG business performance.
FMCG Executive Analytics Dashboard
Key insights dashboard for FMCG teams and leadership
The FMCG Sector – Finance Dashboard serves as the executive analytics dashboard that leadership teams rely on. It provides a quick snapshot of total sales, profit margins, stock status, OTIF, and top growth regions. FMCG managers and decision-makers need this one view to track business operations without digging into multiple reports. The dashboard allows leadership to monitor key performance indicators and compare results across product categories and FMCG brands. It also highlights areas needing improvement such as declining inventory turnover, rising stockouts, or underperforming distributors. By combining data from multiple sources into one dashboard, executives gain key insights and can drive data-driven decisions across the organization.
Strategic analytics dashboard reporting and forecasting
The strongest FMCG dashboard templates include forecasting. This strategic analytics dashboard tracks forecast accuracy, demand forecast trends, and supply planning KPIs. It supports long-term decisions like production planning, inventory investment, and new market entry strategies. With data analytics, FMCG companies can build data-driven strategies that reduce uncertainty and improve competitive advantage. The dashboard provides real-time insights into demand signals from retail and e-commerce. Forecasting also helps prevent out-of-stock problems during high-demand periods and reduces overstock during slow seasons. With strong business intelligence reporting, the dashboard turns raw sales and supply chain data into actionable plans—helping FMCG industry leaders optimize operations and improve profitability.
The 4 FMCG Dashboards Included in This Package
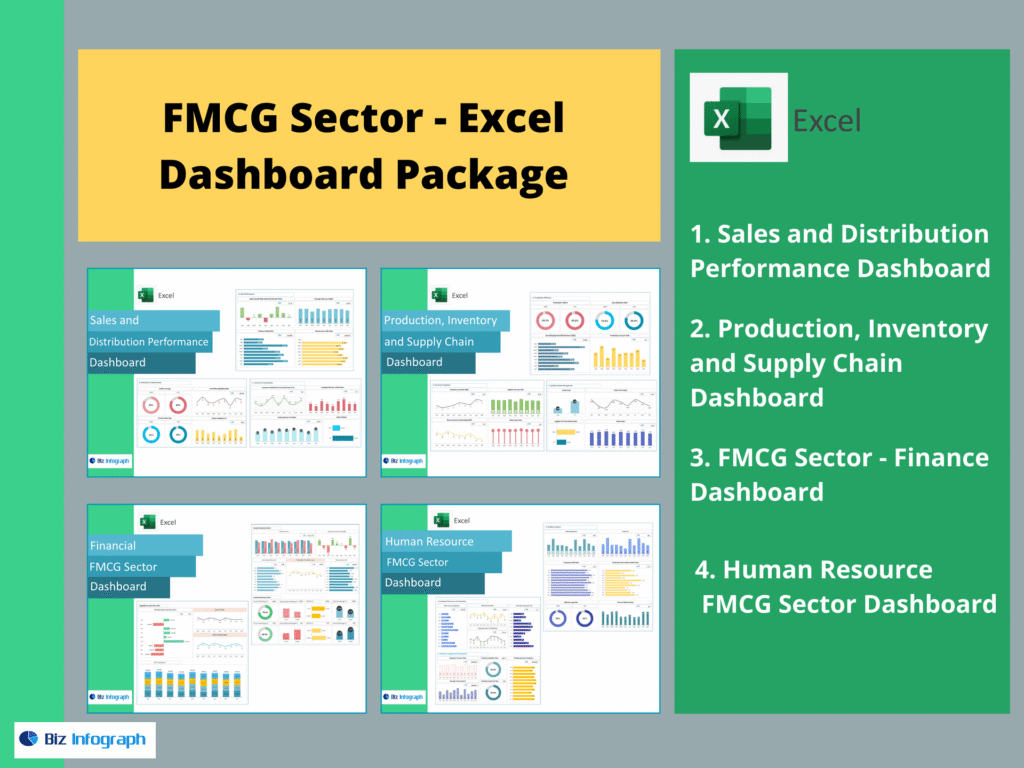
A complete FMCG reporting system should include these four dashboards: Sales and Distribution Performance Dashboard, Production, Inventory and Supply Chain Dashboard, FMCG Sector – Finance Dashboard, and Human Resource FMCG Sector Dashboard. Together, they create a powerful FMCG dashboard package that connects data sources from sales, warehouse, finance, and HR, enabling FMCG teams to make informed decisions using real-time insights and data-driven strategies.
For ready-to-use Dashboard Templates: