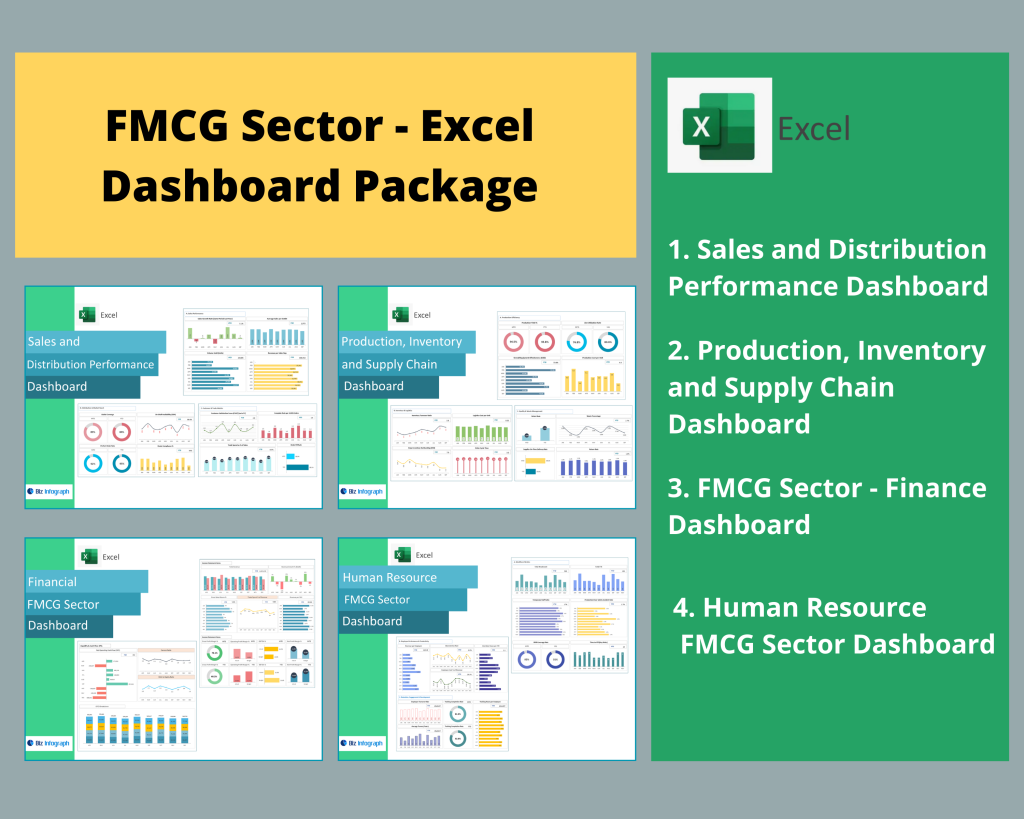
Introduction to FMCG Dashboard Package
What Is an FMCG Dashboard?
An FMCG dashboard is a data visualization platform designed to simplify the tracking and analysis of fast-moving consumer goods performance. It provides a clear view of sales, inventory, and logistics by consolidating business data from multiple data sources such as ERP systems, POS terminals, and e-commerce platforms. These dashboards help FMCG companies analyze key metrics like sales volume, stock levels, and fill rate on a daily basis. By presenting data in real time, the FMCG dashboard empowers management to make data-driven decisions, improve efficiency, and maintain high product availability while avoiding stockouts and overstock situations that can hurt profitability.
Importance of Dashboards in the FMCG Industry
In the FMCG industry, where speed, precision, and adaptability define success, having a well-structured dashboard is essential. Businesses in the fast-moving consumer goods sector handle vast quantities of data — from customer orders and inventory levels to vendor performance and distribution channels. A robust FMCG dashboard integrates this business data to give decision-makers a better understanding of regional demand, consumer behavior, and market share trends. It enables teams to optimize business operations, reduce waste, and streamline fulfillment processes. Through data analytics and visual KPIs, FMCG leaders gain the ability to make quick, informed decisions that maintain competitiveness and profitability.
How the FMCG Dashboard Package Supports Data-Driven Decision Making
The FMCG Dashboard Package is built to empower data-driven decision making across all levels of the organization. It connects to data sources like ERP systems, sales platforms, and warehouse software to generate a unified overview of performance. This solution helps FMCG business users evaluate sales data, inventory management, and distribution channels in one place, providing key insights into operational bottlenecks. By delivering metrics such as OTIF (On-Time In-Full) rates, stock turnover rate, and delivery rate, it enables better planning and optimization of processes. Ultimately, this dashboard package helps FMCG companies make strategic decisions quickly and confidently based on real-time analytics.
Overview of FMCG Analytics and Data Models
Understanding the FMCG Data Model Structure
A solid data model lies at the core of effective FMCG analytics. The FMCG data model integrates sales data, inventory levels, customer data, and warehouse information from multiple data sources to build a cohesive analytical framework. This allows businesses to analyze how distribution channels, pricing, and consumer behavior interact to influence profit and market share. The data model is structured to capture key insights like stockouts, turnover rate, and product movement across different sectors. By using Power BI or similar tools, FMCG companies can efficiently process raw business data into actionable reports that simplify complex decision-making and promote data-driven strategies.
H3: Key Metrics and KPIs in FMCG Analytics
KPIs are the foundation of any FMCG dashboard. Tracking essential metrics like sales volume, stock levels, fill rate, delivery rate, and OTIF ensures timely decision making. These KPIs help identify bottlenecks in warehouse operations and inventory management, giving managers a clear view of areas needing improvement. Other important indicators include turnover rate, product availability, discount impact, and profit margins. In the fast-moving consumer goods industry, FMCG analytics provides a data-driven approach to measuring performance and optimization. By continuously monitoring these KPIs, businesses can evaluate trends, anticipate challenges, and make data-driven decisions that strengthen their FMCG business performance.
Integrating Data Sources for Comprehensive FMCG Analysis
To deliver a complete overview of operations, FMCG dashboards rely on integrating data sources like ERP systems, e-commerce platforms, and warehouse software. These integrations allow for real-time data analytics, combining sales data, customer orders, and inventory levels into one system. The result is a single source of truth for the FMCG industry, enabling data-driven evaluations and better understanding of the supply chain. Such integration not only enhances business operations but also reduces manual errors and improves on-time deliveries. With a connected data model, decision-makers can analyze performance patterns, monitor trends, and optimize processes across multiple departments efficiently.
Features of the FMCG Dashboard Template
Warehouse and Inventory Management Dashboards
The warehouse and inventory management modules of an FMCG dashboard are vital for monitoring stock levels, product availability, and fulfillment efficiency. These dashboards use data analytics to prevent stockouts and overstock situations by providing a clear view of inventory levels in real time. Managers can track turnover rates, vendor performance, and on-time delivery using data-driven visual indicators. With integrated data sources, the dashboard supports accurate better planning and optimization of supply chain workflows. Using Power BI or other platforms, FMCG teams can visualize warehouse dynamics to reduce waste, maintain ideal inventory levels, and ensure consistent product flow to customers.
Sales and Distribution Performance Dashboards
Sales and distribution are the backbone of any FMCG business, and a dedicated FMCG dashboard provides crucial key insights into these functions. It consolidates sales data across distribution channels, e-commerce platforms, and regional demand centers to help teams understand customer preferences and buying trend patterns. This dashboard template highlights KPIs such as sales volume, market share, and delivery rate, empowering teams to make data-driven decisions that optimize business operations. The fast-moving consumer goods sector benefits greatly from such data analytics, as it ensures on-time deliveries, improved customer orders tracking, and smarter strategic decisions that drive growth and profitability.
Marketing and Consumer Insights Dashboards
A marketing dashboard within the FMCG dashboard package helps companies understand customer behavior and analyze consumer behavior trends across segments like personal care, food, and beverages. Using FMCG analytics, businesses can analyze campaign performance, pricing strategies, and brand portfolio effectiveness. The dashboard visualizes sales data, discount usage, and regional demand to identify what influences customer preference. This data-driven platform enables FMCG business leaders to make strategic decisions that improve marketing ROI and customer loyalty. Equipped with powerpoint templates for reporting, this tool simplifies communication and helps FMCG companies stay agile in a competitive fast-moving consumer goods marketplace.
Key Insights from the FMCG Dashboard
Identifying Trends in Sales and Demand Patterns
An FMCG dashboard provides real-time insight into sales data, allowing managers to identify emerging trend patterns across distribution channels and product categories. These data-driven dashboards help FMCG companies evaluate market shifts, analyze customer data, and forecast regional demand. Using data analytics, businesses can pinpoint fluctuations in sales volume and understand the drivers of consumer behavior. This enables better planning, targeted promotions, and pricing optimization. By continuously monitoring key insights, organizations in the fast-moving consumer goods sector can quickly adapt to market share changes, ensuring steady growth and alignment with consumer preferences.
Analyzing Supply Chain and Warehouse Efficiency
The supply chain and warehouse operations form the backbone of every FMCG business. With an FMCG dashboard, companies can analyze inventory levels, monitor delivery rate, and improve OTIF performance. The system highlights bottlenecks that affect on-time deliveries and helps track vendor compliance. Data-driven insights enable teams to simplify complex logistics, reduce waste, and optimize delivery routes. Through data analytics, FMCG managers can ensure product availability while minimizing overstock and stockouts. By maintaining a detailed inventory view, businesses can efficiently align supply with customer orders, enhancing service reliability and overall profit margins.
Driving Data-Driven Decisions Through Real-Time Analytics
Real-time data analytics is the cornerstone of the FMCG dashboard package. It provides key insights that allow managers to make data-driven decisions with speed and confidence. By visualizing sales data, inventory levels, and warehouse performance, decision-makers gain a clear view of the business operations on a daily basis. These dashboards enable leaders to evaluate performance, forecast regional demand, and adjust pricing or portfolio strategies instantly. The integration of data sources ensures accuracy and consistency, helping organizations optimize supply chains and ensure on-time fulfillment. This leads to improved profit, higher customer satisfaction, and smarter strategic decisions across the FMCG industry.
Benefits of Using the FMCG Dashboard Package
Streamlined Data Collection and Analysis for FMCG Companies
The FMCG dashboard package simplifies data collection and reporting by consolidating data sources from ERP, CRM, and e-commerce platforms. This data-driven system gives FMCG managers a better understanding of performance through a unified view of sales data, inventory management, and warehouse operations. The result is a streamlined process that eliminates manual reporting and reduces human error. The dashboard allows teams to evaluate operations, detect inefficiencies, and optimize business operations. By leveraging FMCG analytics, organizations gain real-time visibility, help FMCG companies make informed decisions, and achieve operational excellence across the fast-moving consumer goods value chain.
Enhanced Inventory Management and Forecasting Accuracy
An effective inventory management dashboard allows FMCG business users to maintain ideal inventory levels and prevent out-of-stock or overstock conditions. Through integrated data analytics, it provides key insights into stock levels, turnover rate, and vendor performance. Real-time visibility enhances on-time delivery and improves fill rate, ensuring customer satisfaction. By monitoring stockouts and warehouse activity, FMCG managers can reduce waste and optimize storage utilization. This approach not only minimizes losses but also enhances forecasting precision through continuous data-driven evaluation. The result is a smarter, more efficiently managed fast-moving consumer goods supply chain with higher accuracy and profitability.
Improved Strategic Decision Making Through Actionable Insights
The FMCG dashboard package gives business leaders the ability to make strategic decisions based on real-time, data-driven analysis. It consolidates business data to deliver key insights into performance across distribution channels, pricing, and consumer behavior. These dashboards provide actionable intelligence for better planning, optimization, and product portfolio management. The data model helps identify trend changes and bottlenecks, ensuring faster responses to market share dynamics. By using FMCG analytics and visualization tools using Power BI, organizations can move from reactive management to proactive planning, achieving greater agility and profit in a highly competitive FMCG industry.
Conclusion
How FMCG Dashboards Transform Business Decision Making
A well-implemented FMCG dashboard transforms decision making by converting business data into visual, data-driven insights. These dashboards bring together sales data, warehouse metrics, and inventory management details in one platform, allowing for precise optimization of business operations. By tracking KPIs and key insights, FMCG leaders gain a better understanding of operational performance and consumer behavior. This promotes agile responses to market share changes and ensures consistent product availability. Ultimately, the FMCG dashboard enables faster informed decisions, improves efficiency, and empowers FMCG companies to thrive in the fast-moving consumer goods sector.
Steps to Implement an Effective FMCG Dashboard Template
Implementing an effective FMCG dashboard template begins with identifying key KPIs, connecting reliable data sources, and establishing a robust data model. Integrate ERP, e-commerce, and warehouse systems to capture sales data, inventory levels, and customer orders. Next, design the dashboard using a platform like Power BI to visualize metrics in real time. Regular analysis ensures alignment with business goals and continuous optimization. Providing PowerPoint templates for reporting can help present key insights effectively to stakeholders. When designed properly, this FMCG dashboard helps simplify decision-making and delivers powerful, data-driven results across all areas of the FMCG business.
For ready-to-use Dashboard Templates: