Introduction to Energy Consumption Dashboard
What Is an Energy Consumption Dashboard in Manufacturing?
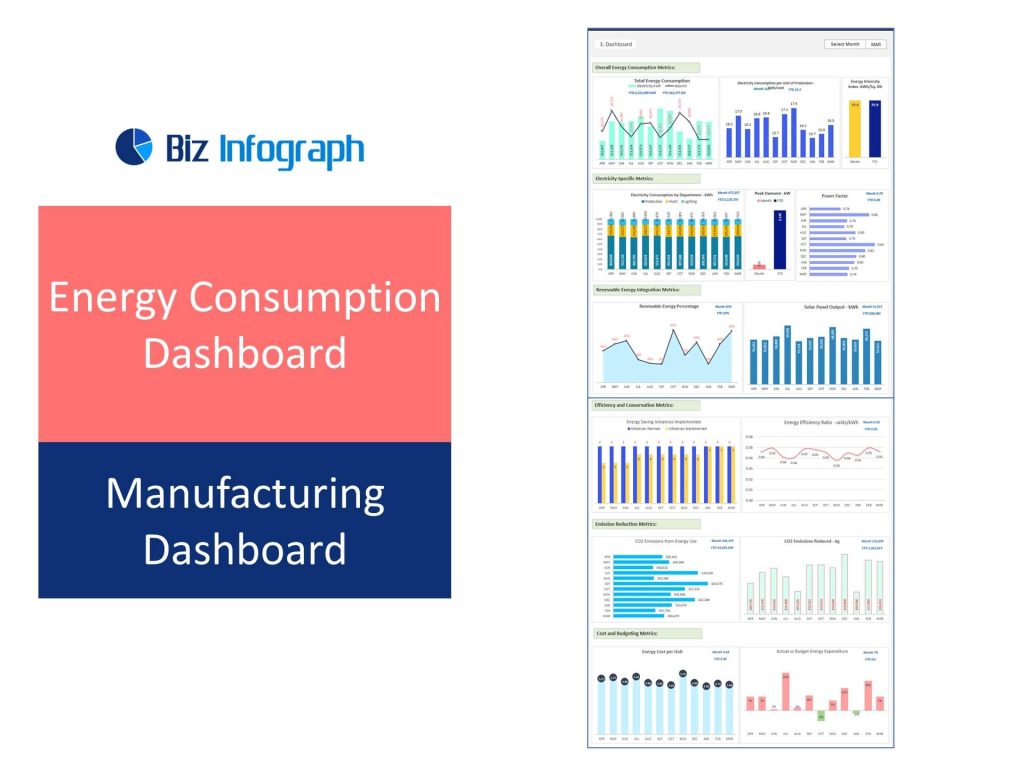
An energy consumption dashboard in manufacturing is a monitoring dashboard that provides real-time visibility into how energy is used across machines, processes, and production lines. It serves as an operational dashboard that helps track total and segmented energy usage, offering detailed insights into where and how energy is consumed. This dashboard to track energy activity is vital for identifying inefficiencies, forecasting future energy needs, and ensuring effective energy management. Leveraging tools like Power BI, companies can visualize energy metrics, identify excessive energy use, and take action to reduce their energy consumption while maintaining productivity.
Importance of Energy Monitoring for Sustainable Manufacturing
In modern manufacturing, energy monitoring is not just about cost—it’s also about sustainability. With rising pressure to reduce the environmental impact of energy, a robust energy monitoring dashboard helps companies ensure compliance with environmental standards and track their green energy initiatives. Dashboards allow manufacturers to measure the proportion of energy sourced from renewable sources and ensure that sustainable energy practices are integrated into day-to-day operations. By gaining a clear overview of energy usage and emissions, businesses can improve operational transparency, set future energy goals, and take proactive steps to reduce waste and support cleaner production.
Role of Dashboards in Energy Management and Optimization
A well-designed energy management dashboard empowers manufacturers to optimize energy usage across production. It consolidates data analysis from different systems into a single visual interface, enabling users to monitor energy consumption patterns, detect inefficiencies, and save energy through targeted actions. These dashboards also support informed decisions to reduce energy and operating costs by offering real-time alerts, consumption comparisons, and performance benchmarks. Dashboards play a central role in energy conservation efforts, giving stakeholders a comprehensive view of energy flow and costs, while helping energy suppliers to cover fast-changing demands effectively within manufacturing operations.
Key Features and KPIs of an Energy Management Dashboard
Energy Performance Indicators and What to Track
Tracking the right energy performance indicators is key to driving efficiency. A typical energy consumption dashboard in manufacturing will monitor metrics such as kilowatt-hours per unit produced, peak energy usage, load factor, and idle consumption rates. These energy metrics help manufacturers evaluate consumption patterns, establish energy usage and efficiency baselines, and identify areas for improvement. Through energy tracking, businesses can set achievable targets and evaluate success. Moreover, monitor energy usage by sector or department enables granular decision-making, ensuring that energy is used where and when it is needed most.
Energy Usage vs. Energy Production: Dashboards That Show the Full Picture
In energy-intensive sectors, understanding both energy usage and energy production is crucial. A comprehensive energy operational dashboard helps manufacturers track energy consumption alongside internal energy production from renewable or waste-to-energy systems. This dual tracking helps manage the energy and cost balance while aligning operations with sustainable energy goals. By evaluating energy consumption by sector and comparing it with on-site renewable energy sources, dashboards offer real-time insights into energy consumption and empower companies to optimize the flow between input and output. These insights are instrumental in reducing reliance on external sources and improving overall energy self-sufficiency.
How KPI Dashboards Help Track Energy Trends and Reduce Costs
KPI dashboards bring transparency to energy trends, highlighting shifts in usage over time and uncovering anomalies. This enables manufacturing leaders to answer key questions for managing energy—such as which processes consume the most power, what hours or days see excessive energy spikes, and where the most savings can be made. By identifying these patterns, organizations can reduce costs through load balancing, off-peak production, or system upgrades. Dashboards built with tools like Microsoft Power BI offer predictive analytics capabilities, allowing manufacturers to anticipate future energy needs and build more resilient, cost-effective operations.
Types and Examples of Energy Dashboards in Manufacturing
Energy Monitoring Dashboards vs. Energy Operational Dashboards
There are key differences between an energy monitoring dashboard and an energy operational dashboard. The former focuses on passive energy tracking—providing a real-time stream of energy usage data, often broken down by department, time, or equipment. The latter goes further, integrating with manufacturing dashboard software to connect energy metrics with production KPIs and operational performance. This dual-purpose view allows teams to understand the relationship between manufacturing processes and energy usage, facilitating smarter, data-driven optimizations. Together, these dashboards support a layered approach to energy management, where insights inform everything from shift scheduling to capital investments.
Examples of Effective Energy Dashboards Using Power BI
Some of the most compelling dashboard examples come from manufacturers using Power BI to create customized energy management dashboards. These dashboards often feature intuitive visuals—gauges, bar charts, and maps—highlighting real-time energy usage, historical trends, and comparative benchmarks. Effective dashboards provide users with tailored views: operators monitor floor-level metrics while executives see enterprise-level summaries. An energy dashboard created in Power BI can integrate with IoT sensors and SCADA systems to provide real-time insights into energy consumption, enabling immediate action. These examples show how technology can transform basic reporting into a strategic advantage.
Dashboard Examples for Tracking Renewable and Green Energy Initiatives
With the increasing emphasis on sustainable energy, dashboards now play a vital role in managing green energy initiatives. A well-designed dashboard to track renewable performance can show the proportion of energy sourced from renewable sources like solar, wind, or biomass. It can compare actual generation vs. expected output and track carbon offset equivalents. Dashboards also reveal how renewable integration affects overall energy costs and energy savings. By aligning these indicators with broader sustainability targets, companies can report progress, meet regulatory requirements, and build trust with customers and stakeholders interested in green practices.
Implementing an Energy Consumption Dashboard
Best Practices for Implementing Energy Monitoring Dashboards
Implementing energy dashboards requires careful planning and collaboration between facilities, IT, and sustainability teams. Start by auditing energy sources and consumption points. Choose a dashboard platform that integrates easily with existing systems and supports real-time data analysis. Define the most impactful energy KPIs, and ensure data accuracy through automated inputs rather than manual entry. Pilot the dashboard in one area before rolling it out more broadly. Training staff to interpret and act on dashboard insights is also critical. Successful implementation leads to improve overall energy oversight and provides the agility needed to respond to fast-changing energy demands.
How to Use Dashboards to Optimize Energy Efficiency
A key benefit of an energy consumption dashboard is its ability to optimize energy efficiency throughout the plant. Dashboards help track energy consumption by machine, production line, or time of day, uncovering inefficiencies like equipment left running during downtime. By benchmarking against best practices and historical data, dashboards inform process changes that save energy without impacting output. In some cases, dashboards enable automated alerts when excessive energy is detected, prompting immediate intervention. This proactive energy management approach leads to long-term energy savings and a more environmentally responsible operation.
Integrating BI and Financial Insights in Energy Dashboards
Linking energy monitoring with financial data provides a powerful layer of insight. Dashboards that merge energy financial indicators—such as cost per unit produced or ROI on energy-saving investments—empower manufacturers to make strategic choices. BI tools like Power BI allow energy data to be analyzed alongside budgets, forecasts, and profitability metrics. This integration gives decision-makers a full picture of how energy consumption patterns affect both operational efficiency and the bottom line. It also allows businesses to justify capital upgrades and validate sustainability programs using measurable financial performance.
Future of Energy Dashboards in Manufacturing
The Shift Toward Sustainable Energy Monitoring Dashboards
As the manufacturing industry embraces decarbonization, sustainable energy monitoring becomes a top priority. Dashboards are evolving to support this shift by tracking renewable integration, emissions data, and sustainability KPIs. These tools help companies manage their energy practices, reduce waste, and align with ESG (environmental, social, and governance) goals. The ability to monitor energy from diverse renewable energy sources, combined with predictive modeling, makes dashboards essential in building a sustainable supply chain. Future dashboards will play an even greater role in optimizing hybrid energy systems and facilitating compliance with international standards.
Using Dashboards to Support Future Energy Goals
Dashboards are not just about today—they are critical for long-term planning. By analyzing energy trends and consumption patterns, companies can forecast demand, evaluate the impact of new technologies, and set realistic future energy goals. Dashboards provide the historical context and current-state analysis necessary to plan expansions, budget for infrastructure, or transition to green energy systems. With the support of manufacturing dashboards, businesses can confidently invest in cleaner technologies and make steady progress toward carbon neutrality and energy independence.
Understanding Energy Patterns for Long-Term Efficiency Gains
Gaining a deeper understanding of how energy is consumed is the first step toward building a smarter factory. Dashboards deliver this understanding by connecting granular energy usage patterns with specific manufacturing operations and outcomes. By surfacing anomalies, peaks, and inefficiencies, they help prevent waste, reduce downtime, and enhance resource planning. When combined with historical benchmarking and external data like weather or utility rates, dashboards allow manufacturers to anticipate and adapt to energy fluctuations. Ultimately, this data-driven approach enables consistent improvements in energy efficiency, helping companies stay competitive in an increasingly energy-conscious world.
For ready-to-use Dashboard Templates: