CFO Dashboard Guide with CFO Dashboard Excel for Financial Performance
Why CFO Dashboard Excel is essential for financial health and decision-making
A CFO Dashboard Excel is one of the most practical tools for managing a company’s financial health. It allows CFOs and finance teams to consolidate financial data into a structured format, providing a clear view of financial performance and position. Instead of relying on static financial reporting, dashboards for CFOs transform raw financial information into insights that support strategic decision-making. By tracking metrics such as gross profit margin, net profit, operating cash flow, and growth rate, a CFO dashboard provides visibility into critical financial areas. This enables CFOs to monitor trends, identify risks, and ensure that financial decisions are based on reliable data. A well-designed dashboard helps organizations maintain control over financial operations and improve long-term performance.
H3: Benefits of CFO Dashboard Excel for tracking financial KPIs and metrics
The benefits of a CFO Dashboard Excel are significant, particularly when it comes to tracking CFO KPIs and dashboards efficiently. CFO KPIs are metrics that reflect financial performance, profitability, and operational efficiency. A dashboard template allows finance teams to monitor key financial metrics such as cost of goods sold, net profit margin, and operating cash flow in one place. By using a comprehensive CFO dashboard, organizations can track profitability metrics, evaluate financial position, and improve financial planning. The dashboard also simplifies reporting by providing a clear and visual representation of data. This improves communication between finance teams and executive leadership, ensuring that everyone has access to consistent and accurate financial information.
How to Build a CFO Dashboard Using CFO Dashboard Excel
Steps to build a CFO Dashboard Excel for financial planning and analysis
Building a CFO Dashboard Excel starts with identifying the key financial metrics that matter to the organization. CFOs should define KPIs related to profitability, liquidity, efficiency, and growth. The next step is to gather financial data from systems such as accounting software, ERP systems, and financial reporting tools. Once data is consolidated, dashboards can be designed using charts, tables, and KPI indicators. A reporting dashboard should include sections for profit and loss, balance sheet, cash flow, and performance metrics. By structuring the dashboard effectively, CFOs can create a comprehensive CFO dashboard that supports financial planning and analysis. This ensures that decision-makers have access to up-to-date information at all times.
Choosing the right metrics in CFO Dashboard Excel for financial performance
Choosing the right metrics is critical to building an effective CFO dashboard. CFOs must focus on key financial metrics that align with business objectives. These include net profit margin, gross profit margin, operating cash flow, revenue growth rate, and cost of goods sold. A CFO dashboard should include metrics that provide insights into both financial and operational performance. By selecting the right metrics, dashboards provide a clear view of financial health and help identify areas for improvement. CFOs can use these insights to optimize costs, improve profitability, and drive business growth. A well-designed dashboard ensures that only relevant metrics are included, making it easier for executives to interpret data and take action.
Key Financial KPIs in CFO Dashboard Excel for CFOs
Core financial metrics in CFO Dashboard Excel for performance tracking
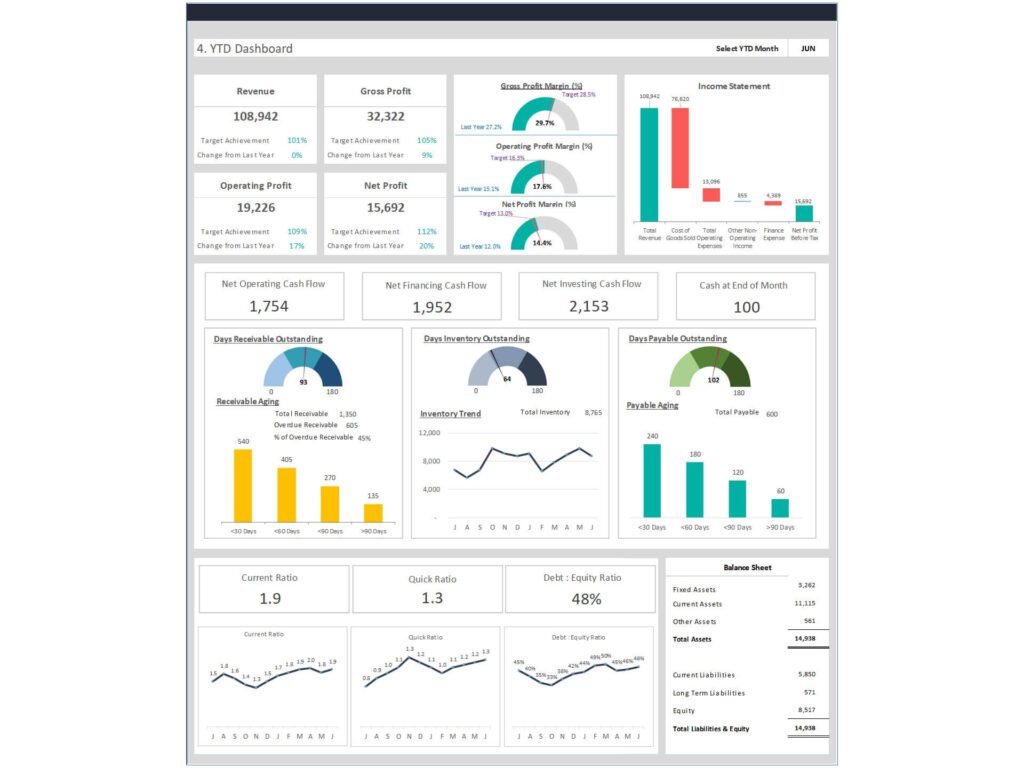
A CFO Dashboard Excel should focus on core financial metrics that reflect the company’s performance. These include revenue, net profit, gross profit margin, and operating cash flow. These metrics provide a snapshot of financial health and help CFOs assess whether the organization is meeting its financial goals. Additional metrics such as cost of goods sold, operating expenses, and EBITDA can also be included to provide a more detailed analysis. By tracking these metrics regularly, CFOs can identify trends, evaluate performance, income statement, and make informed financial decisions. This ensures that the organization remains financially stable and competitive.
KPI dashboard design using CFO Dashboard Excel for financial insights
Designing a CFO KPI dashboard requires a focus on clarity and usability. The dashboard should present financial data in a way that is easy to understand and actionable. Charts and visualizations should highlight key trends and performance indicators, while tables can provide detailed financial information. A well-designed dashboard visually communicates financial insights, making it easier for CFOs to interpret data quickly. By organizing data into sections such as profit and loss, balance sheet, and cash flow, CFOs can gain a comprehensive view of financial performance. This supports better financial planning and decision-making across the organization.
Interactive Financial Dashboard Using CFO Dashboard Power BI
Building interactive dashboards with CFO Dashboard Power BI for real-time analytics
A CFO Dashboard Power BI takes financial reporting to the next level by enabling interactive and real-time analytics. Unlike static reports, Power BI dashboards allow CFOs to explore data dynamically, drill down into specific metrics, and analyze trends across different dimensions. By integrating data from multiple sources, Power BI provides a comprehensive view of financial performance. This helps CFOs monitor key financial metrics and respond quickly to changes in the business environment. Interactive dashboards also support collaboration, allowing finance teams and executives to share insights and make data-driven decisions more effectively.
Dashboard examples for CFOs using CFO Dashboard Power BI
There are many dashboard examples that demonstrate the power of CFO Dashboard Power BI. For example, a financial dashboard can include sections for revenue analysis, expense tracking, and cash flow management. These dashboards provide a clear overview of financial performance and highlight areas that require attention. By using BI tools, CFOs can create custom dashboards that meet their specific needs. These dashboards are designed to support strategic decision-making by providing real-time insights into financial and operational performance. With Power BI, CFOs can build dashboards that are both scalable and flexible, making them suitable for organizations of all sizes.
Using CFO Dashboard Google sheet for Financial Planning
Benefits of CFO Dashboard Google sheet for financial forecasting and collaboration
The CFO Dashboard Google sheet is a powerful tool for financial planning and collaboration. It allows multiple users to access and update financial data in real time, making it ideal for finance teams working remotely. Google Sheets supports financial forecasting by enabling users to create models and scenarios based on different assumptions. This helps CFOs plan for future growth and manage risks effectively. By using a collaborative dashboard solution, organizations can improve communication and ensure that everyone is working with the same data. This enhances the accuracy and reliability of financial planning processes.
Real-time financial data analysis with CFO Dashboard Google sheet
Real-time data analysis is essential for effective financial management. A CFO Dashboard Google sheet provides real-time updates, allowing CFOs to monitor financial performance continuously. By analyzing financial data as it is generated, CFOs can identify trends, detect anomalies, and take corrective actions quickly. This is particularly important for managing cash flow and controlling costs. Google Sheets also supports integration with other tools, enabling data from multiple sources to be combined into a single dashboard. This ensures that CFOs have access to accurate and up-to-date information, supporting better decision-making.
Custom CFO Dashboard Solutions for Business Intelligence
Designing a custom CFO Dashboard with KPIs and metrics for financial performance
A custom CFO dashboard allows organizations to tailor their dashboards to specific business needs. By selecting relevant Key Performance Indicators and metrics, CFOs can create dashboards that provide meaningful insights into financial performance. Custom dashboards can include features such as automated reporting, data integration, and advanced analytics. These dashboards are designed to support business intelligence initiatives, providing a comprehensive view of financial and operational performance. By using a custom dashboard solution, organizations can improve financial reporting, enhance decision-making, and drive business growth.
BI tools and dashboard templates for CFO Dashboard implementation
Implementing a CFO dashboard requires the right tools and templates. BI tools such as Power BI provide advanced analytics capabilities, while Excel and Google Sheets offer flexibility and ease of use. Dashboard templates can help organizations get started quickly by providing a pre-built structure for financial reporting. These templates can be customized to meet specific requirements, ensuring that the dashboard includes all relevant metrics. By leveraging BI tools and templates, organizations can build dashboards that support financial planning, reporting, cash conversion cycle, and analysis effectively.
Best Practices for CFO Dashboard Design and Reporting
Key financial metrics every CFO Dashboard should include
A CFO dashboard should include key financial metrics that provide a comprehensive view of the organization’s performance. These include revenue, accounts receivable, net income, accounts payable, net profit, gross profit margin, operating cash flow, and cost of goods sold. Additional metrics such as return on investment, liquidity ratios, and working capital can also be included. By tracking these metrics, CFOs can assess financial health and identify areas for improvement. A well-designed dashboard ensures that all critical financial information is easily accessible and actionable.
Improving financial dashboards for CFOs with better analytics
Improving financial dashboards requires a focus on data quality, visualization, and usability. Dashboards should be designed to provide clear and actionable insights, with a focus on key metrics and trends. By using advanced analytics and BI tools, Chief Financial Officers can gain deeper insights into financial performance. Regular updates and reviews ensure that the dashboard remains relevant and accurate. By continuously improving dashboards, organizations can enhance financial reporting, support strategic decision-making, and drive business growth.
For ready-to-use Dashboard Templates: