Cash Flow Dashboard Template Guide with Cash Flow Dashboard Excel Template Dashboard Excel
Why Cash Flow Dashboard Excel Template Dashboard Excel is essential for cash flow management
A Cash Flow Dashboard Excel Template Dashboard Excel is essential for managing a company’s cash flows effectively. It provides a structured way to track cash inflows and outflows, ensuring that organizations maintain sufficient liquidity. Businesses need to track cash movements, monitor current cash, and understand their immediate spending power. Without proper visibility, companies risk cash shortages that can impact operations. A well-designed dashboard provides a comprehensive view of cash flow data, helping organizations manage their financial health. It allows finance teams to analyze opening cash balance, closing cash balance, and cash levels over time. This type of dashboard helps organizations understand their cash position and ensures that financial decisions are based on accurate data.
Benefits of Cash Flow Dashboard Template for real-time cash flow and financial planning
The Cash Flow Dashboard Template provides real-time cash flow insights, enabling businesses to monitor cash flow trends and make informed decisions. By using a robust cash flow dashboard, organizations can analyze projected cash, expected cash, and actual cash received. This helps improve forecast accuracy and supports better financial planning. Dashboards provide insights into liquidity ratio and overall cash flow, helping organizations assess their financial stability. The dashboard allows users to track cash inflows, manage cash outflows, and optimize cash management processes. With real-time data, businesses can respond quickly to changes in cash flow and ensure they have sufficient funds to meet obligations.
How to Build Cash Flow Dashboard Template Using Cash Flow Dashboard Excel Template Dashboard Excel
Steps to build a Cash Flow Dashboard Excel Template Dashboard Excel for cash flow forecast
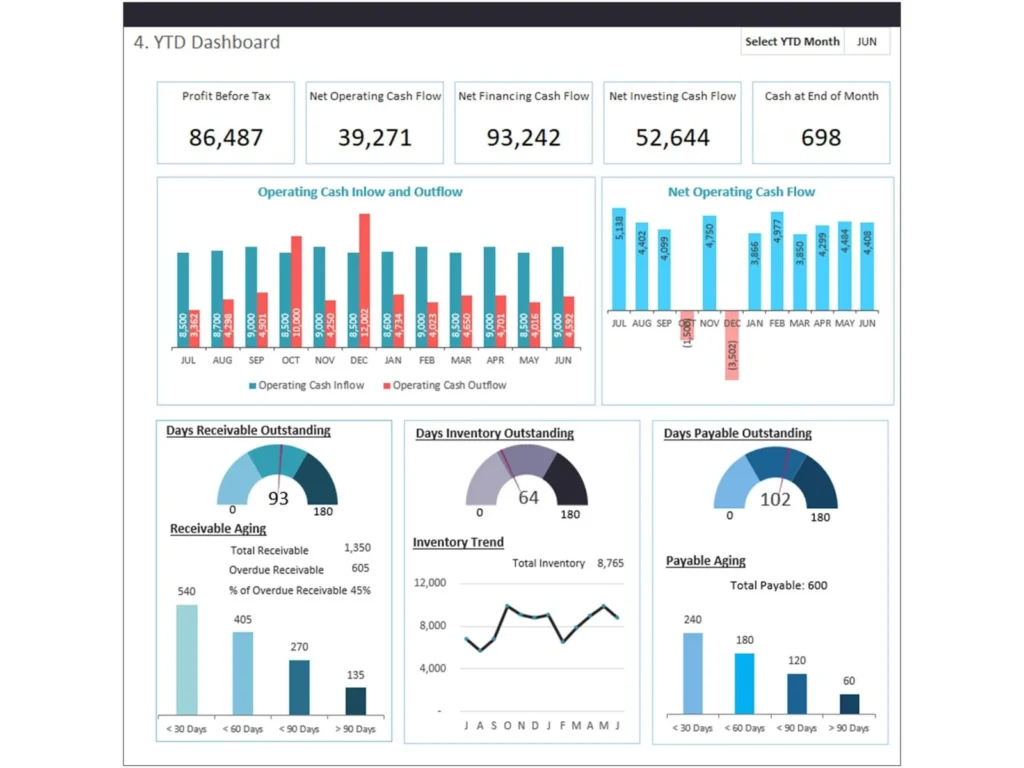
Building a Cash Flow Dashboard Excel Template Dashboard Excel involves several key steps. First, define the structure of your dashboard, including sections for cash inflows, net cash flow, investment, cash outflows, and cash flow projections. Next, gather cash flow data from accounting systems and financial reports. Using Microsoft Excel, create a template that captures actual cash, forecasted cash, and expected cash. The dashboard should include metrics such as operating cash flow, free cash flow, and liquidity ratio. By organizing data into a clear format, users can track month-to-month cash movements and analyze trends. The template works best when it includes automated calculations, ensuring that cash flow projections are accurate and up to date.
Choosing the right metrics in Cash Flow Dashboard Excel Template Dashboard Excel for reporting
Choosing the right metrics is critical for effective cash flow reporting. The Cash Flow Dashboard Excel Template Dashboard Excel should include key metrics such as operating cash flow, free cash flow, cash received, and cash outflows. These metrics provide a clear view of the organization’s cash position. Additionally, tracking opening and closing cash balances helps ensure accuracy in financial reporting. By focusing on the right metrics, dashboards provide insights into cash flow trends and help identify potential issues. This enables organizations to manage cash effectively and improve financial performance. Selecting relevant metrics ensures that the dashboard provides meaningful insights that support decision-making.
Key KPIs in Cash Flow Dashboard Template Dashboard Excel for Liquidity Tracking
Financial metrics and KPI dashboard in Cash Flow Dashboard Excel Template Dashboard Excel
A KPI dashboard is essential for tracking liquidity and financial performance. The Cash Flow Dashboard Excel Template Dashboard Excel should include key performance indicators such as liquidity ratio, operating cash flow, and free cash flow. These metrics help organizations assess their financial health and ensure they have sufficient funds to meet obligations. By tracking KPIs, businesses can monitor cash levels, analyze trends, and identify areas for improvement. Dashboards provide insights into financial performance, enabling organizations to make informed decisions and maintain stability.
Cash flow forecast and real-time cash flow tracking in Cash Flow Dashboard Excel Template Dashboard Excel
Cash flow forecasting is a critical component of financial planning. The Cash Flow Dashboard Excel Template Dashboard Excel allows users to compare forecasted cash with actual results, improving forecast accuracy. By tracking real-time cash flow, organizations can monitor cash movements and respond to changes quickly. This helps prevent cash shortages and ensures that businesses can meet their financial obligations. The dashboard provides a comprehensive view of cash flow data, enabling users to analyze trends and make proactive decisions.
Financial Reporting with Cash Flow Dashboard Template Dashboard Excel
H3: Reporting dashboard and management dashboard using Cash Flow Dashboard Excel Template Dashboard Excel
A reporting dashboard is essential for financial reporting and analysis. The Cash Flow Dashboard Excel Template Dashboard Excel provides a clear and structured view of cash flow data, making it easier to analyze performance. A management dashboard allows executives to monitor cash flow trends, track key metrics, and make informed decisions. By consolidating data into a single view, dashboards provide a comprehensive overview of financial performance. This helps organizations improve financial management and ensure that decisions are based on accurate data.
Dashboard examples for cash flows and analytics in Cash Flow Dashboard Excel Template Dashboard Excel
There are many dashboard examples that demonstrate the effectiveness of cash flow dashboards. These dashboards typically include charts, graphs, and KPI indicators that highlight cash flow trends. By visualizing data, users can quickly identify patterns and make informed decisions. Analytics dashboards provide deeper insights into cash flow performance, enabling organizations to optimize their financial management processes. These examples show how dashboards can be used to improve financial reporting and decision-making.
Interactive Analytics with Cash Flow Dashboard Template Power BI
Building interactive dashboards with Cash Flow Dashboard Template Power BI for real-time insights
A Cash Flow Dashboard Template Power BI enables organizations to create interactive dashboards that provide real-time insights. Unlike static dashboards, Power BI dashboards allow users to explore data dynamically, filter information, and analyze trends. This helps organizations gain a deeper understanding of their cash flow and make better financial decisions. By integrating data from multiple sources, Power BI provides a comprehensive view of cash flow performance.
BI dashboards and analytics using Cash Flow Dashboard Template Power BI
BI tools such as Power BI provide advanced analytics capabilities, enabling organizations to build custom dashboards that meet their specific needs. These dashboards provide insights into cash flow trends, liquidity, and financial performance. By using BI tools, organizations can improve their financial management processes and make data-driven decisions. Interactive dashboards provide a more engaging and effective way to analyze data.
Using Cash Flow Dashboard Google sheet for Real-Time Cash Flow Tracking
Benefits of Cash Flow Dashboard Google sheet for collaboration and real-time cash flow
The Cash Flow Dashboard Google sheet is a powerful tool for collaboration and real-time cash flow tracking. It allows multiple users to access and update data simultaneously, ensuring that information is always up to date. This is particularly useful for organizations that need to track cash flow across multiple departments. By using Google Sheets, businesses can streamline their cash flow management processes and improve communication.
Streamline your cash flow using Cash Flow Dashboard Google sheet
Using a Cash Flow Dashboard Google sheet, organizations can streamline their cash flow management processes. The dashboard allows users to track cash inflows, manage cash outflows, and analyze trends. By providing real-time insights, the dashboard helps organizations make informed decisions and improve financial performance. This ensures that businesses can manage their cash effectively and achieve their financial goals.
Custom Dashboard Solutions for Cash Flow Management
Build custom dashboards using Cash Flow Dashboard Template for financial insights
Custom dashboards allow organizations to tailor their cash flow analysis to specific needs. The Cash Flow Dashboard Template can be customized to include relevant metrics and visualizations. This enables organizations to gain deeper insights into their financial performance. By building custom dashboards, businesses can improve their financial management processes and make better decisions.
Dashboard software and template solutions for cash flow management
Choosing the right dashboard software is essential for effective cash flow management. There are many tools available that support dashboard creation, including Excel, Power BI, and Google Sheets. These tools provide flexibility and scalability, allowing organizations to build dashboards that meet their needs. By using the right tools, businesses can improve their financial management processes and achieve better results.
Best Practices for Cash Flow Dashboard Template Implementation
Designing an effective financial dashboard using Cash Flow Dashboard Template
Designing an effective financial dashboard requires a focus on clarity and usability. The dashboard should include key metrics and visualizations that provide insights into cash flow performance. By following best practices, organizations can create dashboards that are both functional and visually appealing.
How dashboards help make informed decisions with Cash Flow Dashboard Template
Dashboards help organizations make informed decisions by providing insights into financial performance. By analyzing data, users can identify trends and make adjustments as needed. This ensures that businesses can manage their cash flow effectively and achieve their financial goals.
For ready-to-use Dashboard Templates: