Accounts Receivable Dashboard Template Guide with Accounts Receivable Dashboard Excel Template Dashboard Excel
Why Accounts Receivable Dashboard Excel Template Dashboard Excel is essential for AR function and receivables tracking
An Accounts Receivable Dashboard Excel Template Dashboard Excel is essential for managing the AR function effectively. It allows finance teams to monitor the company’s accounts receivable, track unpaid invoices, and analyze customer payment behavior in one centralized dashboard. By capturing key AR data such as open invoices, due dates, and overdue receivables, the dashboard provides a clear view of outstanding balances. This visibility helps AR managers and CFOs understand the financial health of the organization. With structured visualization, dashboards help track receivables performance, highlight past due invoices, and ensure that collections are managed efficiently. A well-designed receivables dashboard simplifies tracking and enables finance teams to stay on top of cash inflows.
Benefits of Accounts Receivable Dashboard Template for monitoring receivables and improving collection efficiency
The Accounts Receivable Dashboard Template offers significant benefits for improving collection efficiency. It helps finance teams monitor overdue invoices, track customer payment patterns, and identify top delinquent accounts. By analyzing key AR metrics such as DSO (days sales outstanding), average collection period, and overdue amount, businesses can take proactive action to improve collections. The dashboard provides real-time data and insights into payment habits, enabling teams to follow up on unpaid invoices more effectively. With automation features and clear reporting, dashboards help reduce manual effort and improve the overall efficiency of the order-to-cash process. This ensures better cash flow and stronger customer relationships.
How to Build Accounts Receivable Dashboard Template Using Accounts Receivable Dashboard Excel Template Dashboard Excel
Steps to create an AR dashboard using Accounts Receivable Dashboard Excel Template Dashboard Excel
Building an Accounts Receivable dashboard starts with collecting accurate accounts receivable data from accounting software or ERP systems. The next step is organizing this data into a structured format, including details such as invoice number, due dates, customer payment status, and outstanding invoices. Using a dashboard template, finance teams can create charts and tables that highlight key insights such as overdue receivables and payment trends. The dashboard should include summary sections for total accounts, average time to collect, and number of invoices. By automating calculations and using Excel formulas, the dashboard gets updated easily, providing real-time visibility into receivables performance. This ensures that AR managers can track and manage collections effectively.
Choosing the right metrics and KPIs in Accounts Receivable Dashboard Excel Template Dashboard Excel
Selecting the right key performance indicators is critical for building an effective accounts receivable dashboard. The dashboard should include key AR metrics such as DSO, CEI (collection effectiveness index), turnover ratio, and average days to collect. These metrics provide insights into how efficiently receivables are being managed. Additional indicators such as overdue amount, days overdue, and highest outstanding amount help identify problem areas. By focusing on different KPIs, finance teams can analyze performance from multiple perspectives. Choosing the right metrics ensures that the dashboard provides actionable insights and supports informed decisions for improving collection efficiency.
Key KPIs in Accounts Receivable Dashboard Template Dashboard Excel for Receivables Management
Essential AR metrics and indicators in Accounts Receivable Dashboard Excel Template Dashboard Excel
An effective accounts receivable KPI dashboard must include essential metrics that measure collection performance and financial health. Key metrics include DSO, average collection period, turnover ratio, and CEI. These indicators help evaluate how quickly customers are paying invoices and how efficiently the AR function is operating. Tracking overdue receivables and past due invoices helps identify risks and prioritize collection efforts. By analyzing these metrics, finance teams can improve cash flow and reduce outstanding balances. The dashboard provides a comprehensive view of receivables, enabling better management of accounts receivable.
KPI dashboard design and visualization in Accounts Receivable Dashboard Excel Template Dashboard Excel
Designing a KPI dashboard requires a focus on clear visualization and usability. The Accounts Receivable Dashboard Excel Template Dashboard Excel should include charts, graphs, and tables that present data in an easy-to-understand format. Visualization helps highlight key insights such as payment trends, overdue invoices, and top delinquent customers. By using color-coded indicators and dashboards software features, users can quickly identify areas that need attention. A well-designed dashboard provides a clear overview of receivables performance, enabling finance teams to take action quickly. This improves efficiency and supports better decision-making.
Financial Reporting with Accounts Receivable Dashboard Template Dashboard Excel
Receivables dashboard and reporting using Accounts Receivable Dashboard Excel Template Dashboard Excel
A account receivables dashboard plays a crucial role in financial reporting by providing a detailed view of accounts receivable data. It includes information on outstanding invoices, payment status, and customer balances. The dashboard provides a clear overview of receivables performance, helping CFOs and finance teams monitor financial health. By analyzing data such as average days to collect and overdue receivables, organizations can identify trends and improve collection strategies. The dashboard also supports reporting for the current year, allowing teams to track progress and measure performance over time.
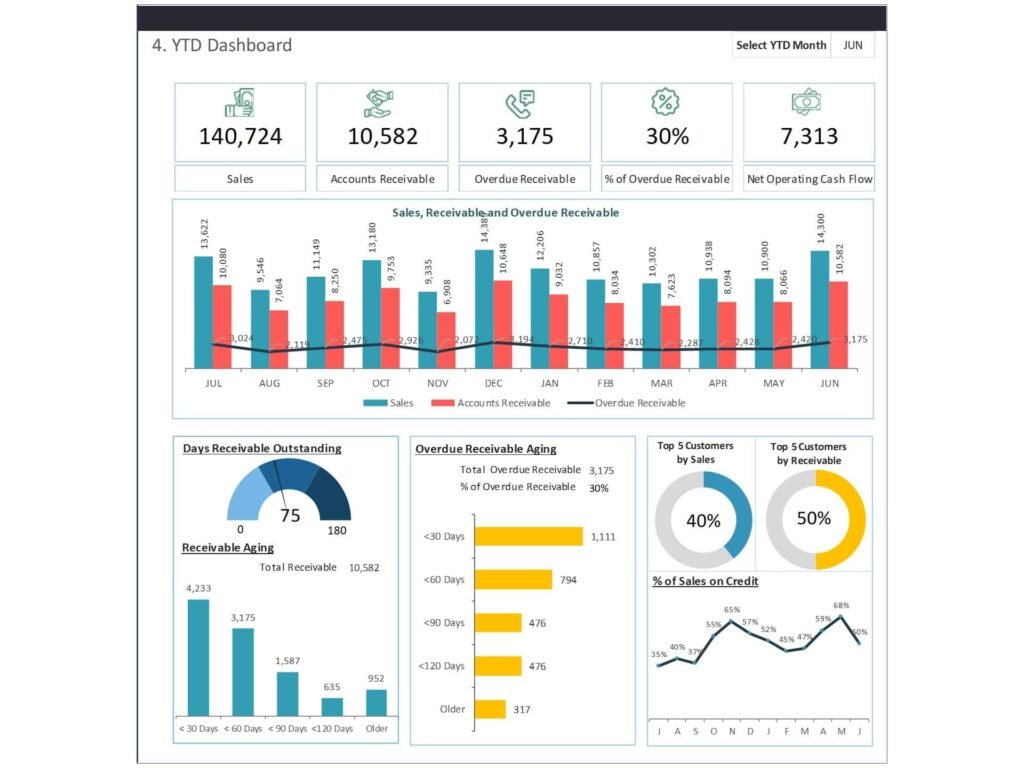
Dashboard examples for accounts receivable and key insights using Accounts Receivable Dashboard Excel Template Dashboard Excel
There are many dashboard examples that demonstrate the effectiveness of accounts receivable dashboards. These dashboards provide insights into key metrics such as DSO, turnover ratio, and overdue amount. By visualizing data, users can quickly identify trends and make informed decisions. For example, dashboards can highlight customers with the highest outstanding balances or invoices that are past due. These insights help finance teams prioritize collections and improve efficiency. By using dashboard templates, organizations can create dashboards that provide actionable insights and support better financial management.
Interactive Analytics with Accounts Receivable Dashboard Power BI
Building interactive dashboards with Accounts Receivable Dashboard Power BI for real-time insights
An Accounts Receivable Dashboard Power BI enables organizations to create interactive dashboards that provide real-time insights into receivables performance. Unlike static dashboards, Power BI dashboards allow users to explore data dynamically, filter information, and analyze trends. By integrating data from multiple sources such as ERP systems and accounting software, Power BI provides a comprehensive view of AR data. This helps finance teams monitor key metrics, track overdue invoices, and identify risks. Interactive dashboards support better decision-making and improve the efficiency of the AR function.
Visualization and BI analytics using Accounts Receivable Dashboard Power BI
BI tools such as Power BI provide advanced analytics capabilities for accounts receivable management. These tools enable users to build custom dashboards, create visualizations, and analyze data in depth. By using BI analytics, finance teams can gain deeper insights into customer payment behavior, payment trends, and financial performance. Visualization helps highlight key metrics and identify areas for improvement. With advanced analytics, organizations can improve collection efficiency and optimize their receivables processes.
Using Accounts Receivable Dashboard Google sheet for Real-Time Receivables Tracking
Benefits of Accounts Receivable Dashboard Google sheet for collaboration and AR tracking
The Accounts Receivable Dashboard Google sheet is a powerful tool for collaboration and real-time tracking. It allows multiple users to access and update data simultaneously, ensuring that information is always up to date. This is particularly useful for finance teams working remotely or across multiple locations. By using Google Sheets, organizations can streamline their receivables tracking processes and improve communication. The dashboard provides real-time data, enabling teams to monitor performance and make informed decisions.
Managing receivables dashboard with Accounts Receivable Dashboard Google sheet
Managing a receivables dashboard using Google Sheets is simple and effective. The platform supports real-time updates, allowing users to track receivables continuously. By analyzing data such as overdue invoices and payment trends, finance teams can identify issues and take corrective action. Google Sheets also integrates with other tools, enabling data from multiple sources to be combined into a single dashboard. This ensures that users have access to accurate and up-to-date information, supporting better financial management.
Integrating Accounts Receivable Dashboard Template with Accounting Software
Connecting accounting software to Accounts Receivable Dashboard Template for automation
Integrating the Accounts Receivable Dashboard Template with accounting software such as Xero or ERP systems enables automation and improves efficiency. By connecting data sources, dashboards can automatically update with the latest information. This reduces manual data entry and ensures accuracy. Automation also allows finance teams to focus on analysis rather than data collection. With integrated systems, dashboards provide real-time insights into receivables performance.
Improving AR function with Accounts Receivable Dashboard Template integration
Integration enhances the effectiveness of the AR function by providing a comprehensive view of receivables. By combining data from multiple sources, dashboards provide deeper insights into financial performance. This helps finance teams identify issues, improve collection efficiency, and strengthen customer relationships. Integrated dashboards support better decision-making and improve overall financial health.
Best Practices for Accounts Receivable Dashboard Template Implementation
Designing an effective accounts receivable dashboard template for KPIs and insights
Designing an effective dashboard template requires a focus on clarity, usability, and relevance. The dashboard should include key metrics and visualizations that provide actionable insights. By using charts and tables, users can easily interpret data and identify trends. A well-designed dashboard provides a clear overview of receivables performance and supports better decision-making.
Improving collection efficiency using Accounts Receivable Dashboard Template
Improving collection efficiency requires continuous monitoring and analysis. The Accounts Receivable Dashboard Template helps finance teams track performance, identify issues, and take corrective action. By analyzing key metrics and trends, organizations can improve their collection processes and reduce outstanding balances. This ensures better cash flow and supports long-term financial stability.
For ready-to-use Dashboard Templates: