

A presentation becomes engaging when each figure serves a clear point, connects to what the audience cares about, and appears in a visual that makes it easy to understand. The key to how to make boring data interesting is to choose relevant charts, images, and examples, then shape them into a focused story. A crowded slide or decorative graphic can distract when it doesn’t help explain the message.
When slides are packed with numbers, it can be hard to know what to cut or how to hold attention. The data itself isn’t the problem. The challenge is giving people a reason to care and a clear path through the information.
Learn how audience-focused topics, storytelling, and purposeful visuals can turn complex information into a presentation people can follow and remember. We’ll look at what makes presentations feel dull, how to give data meaning, and how to choose visuals that support your message.
Key Takeaways
- Give each slide one clear message, and let the headline tell your audience what matters most.
- Connect figures to your audience’s priorities so the information feels relevant, not abstract.
- Shape selected data into a story with context and a clear beginning, middle, and end.
- Choose charts and images that clarify the point, rather than adding visual decoration.
1. What makes a boring presentation?
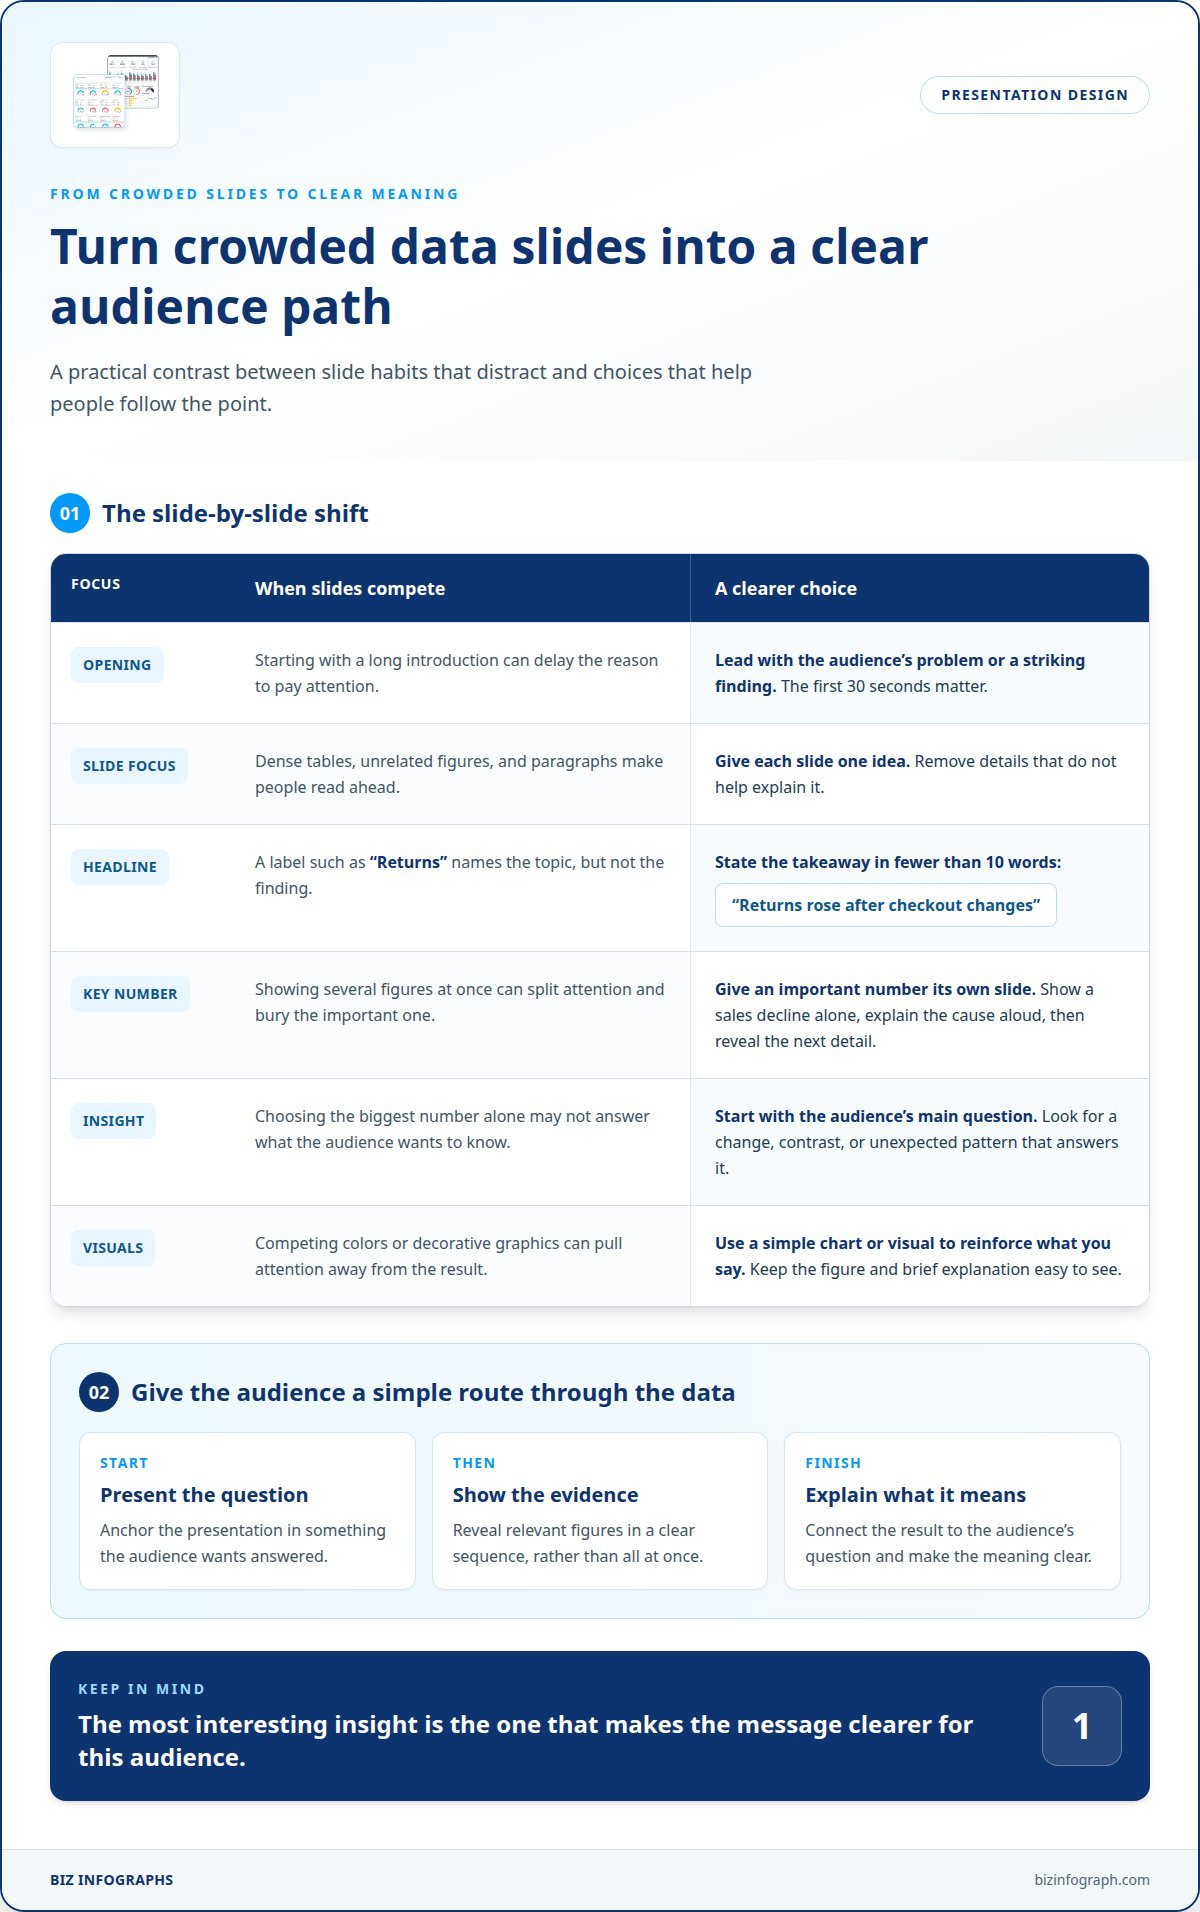
A presentation feels boring when slides compete with the speaker instead of supporting the message. A dense table, several unrelated figures, and paragraphs of text force people to read ahead. The first 30 seconds also matter: begin with the audience’s problem or a striking finding, not a long introduction. Keep each slide focused on one idea, and remove details that don’t help explain it.
Give an important number its own slide when it deserves the audience’s full attention. For example, show a sales decline alone, then explain the cause aloud before revealing the next detail. Write a headline that captures the slide’s main point in fewer than 10 words. “Returns rose after checkout changes” gives viewers more direction than “Returns.” Use a simple chart or visual to reinforce your spoken explanation, rather than making the audience read every data point from the screen.
To find the most interesting insight in a dataset, start with the audience’s main question. Look for a change, contrast, or unexpected pattern that helps answer it, then check the relevant figures and context. A useful insight isn’t necessarily the largest number; it’s the finding that makes the message clearer for that audience.
A vivid background photo can help people remember a number shown on its own slide, even if the image isn’t related to the data. Use that treatment selectively: a clear figure and brief explanation should remain easy to see. Vary visual themes to mark a shift in the story, such as moving from a trend chart to a single highlighted result. David JP Phillips’s 2014 TED Talk about presentations is a reminder that slide choices shape how a message lands.
Common storytelling mistakes include piling on figures without context, revealing every result at once, and adding visuals that don’t clarify the point. For example, a chart with several competing colors can draw attention away from the result being discussed. Instead, build a clear sequence: present the question, show the evidence, and explain what it means. Each visual should help the audience follow the story.
2. Connect the topic to the audience’s interests
A number earns attention when it answers a question your audience already has. Before choosing figures, identify what people need to decide, understand, or change after the presentation. For a customer service team, repeat purchases may matter more than total website visits. For executives, the same dataset could show whether a new policy supports business goals. This shift in emphasis makes findings relevant, not just impressive. To make boring data interesting, connect each finding to a decision the audience faces.
Make abstract quantities easier to grasp by comparing them with a familiar local reference. For example, a presentation might explain selling more than 200,000 units in one month by comparing that quantity to filling Lincoln Financial Field three times. The comparison gives the audience a mental picture, while the sales figure preserves the actual scale. Choose a landmark or everyday reference your specific group will recognize, not an analogy that needs its own explanation.
Facts become more meaningful when you connect them to people’s needs. If a service change reduces delays, explain what that means for customers seeking help or employees handling requests. If a trend affects a community, show who experiences the change and how. These connections add human meaning without exaggerating the result, helping engage people who might not care about the metric alone.
Build the connection throughout the presentation, not just in its opening moment. Introduce a question the audience wants answered, return to it when showing evidence, and close with the practical implication. Whatever the topic, choose examples that reflect the group’s work, location, or decisions. A useful slide can pair a clear figure with a short explanation of its impact. If you’re exploring how to make boring data interesting, audience-focused presentation visuals can help keep the message easy to follow.
3. Using storytelling to make data presentations memorable
A strong presentation gives figures a clear beginning, middle, and end. Start with a question, show evidence, then explain what the result means. For example, customer retention improved by 24% in one quarter after a new service protocol. Explain the protocol first, reveal the change next, and finish with its relevance to customers. That sequence helps people listen for meaning instead of reading disconnected figures.
A memorable opening can also make the stakes clear. One presentation hook describes a U.S. Army camouflage mistake costing $5 billion. The surprising cost creates curiosity, while the details explain why the mistake mattered. Use a real, relevant backstory to set context, then include only the data that supports it. Avoid dramatic claims that the evidence cannot support.
Keep attention by revealing results step by step. On a busy chart, use animation to highlight the figure you’re discussing, rather than displaying every detail at once. An interactive timeline can help audiences explore dense results data, while a poll or question adds a moment of participation. If people face spreadsheets and bullet points for 45 minutes or an hour, change the format with a graphic, video, relevant quote, or audience poll.
Beginners can create clear visualizations with spreadsheet chart features and presentation software. Choose a data presentation template that fits the story: a timeline for changes across stages, or a simple chart for comparing results. Keep labels readable, and use interactive elements only when they add useful context. Turning a table into a chart can help, as long as the visual preserves the figures and their meaning.
To make data storytelling engaging and easy to understand, connect a clear question to relevant evidence, then explain the takeaway in plain language. Preserve the data’s scale and context, label visuals accurately, and show relevant results rather than cherry-picking. A clear sequence, not visual effects alone, makes the message memorable without misleading the audience.
4. Choosing relevant charts, images, and examples
Start with the question your visual needs to answer. Use a bar chart to compare categories, a line chart to show change over time, or a map to reveal differences across locations. An interactive map can help an audience explore regional results. The right format makes patterns easier to spot without asking viewers to decode an unrelated design.
Match the chart to the structure of the data. A Pareto diagram combines bars and a line to show categories alongside a cumulative total. A dot plot uses dots or filled circles to display values clearly. Scatterplots can show how separate values vary over time. Each format has a distinct purpose, so don’t choose a chart just because it looks familiar.
Use images to support the story, not compete with the figures. A circle graph, also called a pie chart, can carry the presentation’s color scheme while showing parts of a whole. Information visualizations can make large amounts of information easier to understand by drawing on natural perceptual abilities, according to UCL. Keep labels legible and use contrast to direct attention to the key result.
Examples help audiences connect a pattern to a real situation. In a meeting about regional demand, pair a map with a brief example of how local needs differ. A relevant photo can establish context, while a meme or GIF may distract in a formal setting. Consider the occasion and audience before using unexpected humor. The strongest image tells part of the same story as the data.
Before finalizing a visual, ask what viewers should notice, whether the scale and labels preserve the data’s meaning, and whether the image adds useful context. If a chart needs lengthy explanation, simplify it or choose another format. Explore Excel Charts to build clear visuals that help your audience focus on the point.
Biz Infographs
Biz Infographs helps you turn data into clear, engaging presentations and visual reports with ready-to-use templates. If you know the story your audience needs but want a more polished way to present it, a template offers a practical starting point without distracting from your message.
Choose PowerPoint Infographic Templates to present information, Excel Dashboard Templates or Power BI Templates to visualize data, and Automation Templates to streamline spreadsheet tasks. Each option supports a different part of working with data, so choose what fits your presentation or reporting needs.
Bring your key figures and message together in a format that’s easier to follow. Contact Biz Infographs to discuss which templates may suit your needs.
Make your next data presentation a stronger conversation
A practical way to make boring data interesting is to treat your next presentation as a chance to start a conversation. Choose one decision you want the audience to consider, then shape your material around that purpose. After presenting, notice which points prompted questions or discussion. Use that response to guide what you emphasize next time.
As you prepare, focus on making the next step clear for your audience. They might need to discuss a finding, explore a trend, or use the information to make a decision. A presentation is more useful when people know what they can do with its message after the meeting. Biz Infographs’ PowerPoint Infographic Templates, Excel Dashboard Templates, and Power BI Templates help you build polished data materials.
Ready to develop your next project? Contact Biz Infographs to discuss your project. You can turn your next presentation into a confident, audience-focused experience.
Frequently Asked Questions
What makes a boring presentation?
A presentation feels dull when viewers can’t quickly tell what to notice or why it matters. For example, a table of quarterly figures without units or labels leaves people guessing. Give every visual a clear purpose, define unfamiliar terms, and state the takeaway. If a slide needs lengthy reading before its point becomes clear, revise it around the audience’s immediate question.
What’s the story?
The story is the meaningful explanation behind the figures: what changed, what might account for it, and why the audience should care. For example, a report on slower deliveries could connect the pattern to particular routes and customer experiences. Keep your interpretation tied to the evidence, and distinguish what the data shows from what you infer. That gives the audience a useful narrative without overstating the findings.
Why should you care about audience engagement?
Audience engagement matters because a presentation should help people understand information and take part in the discussion. When a team sees a trend affecting its daily work, it can ask focused questions and identify what needs attention. Participation can also reveal whether terms, assumptions, or conclusions need clarification. Pause for questions or reactions, then use the responses to guide the conversation.
What are the best ways to visualize data for a general audience?
Use a familiar chart, descriptive labels, and a clear explanation of the takeaway. A bar chart can compare product categories, while a line chart shows how a measure changes over time. For location-based results, a map can make geographic patterns visible. Avoid decorative effects that obscure values, and provide enough context for someone seeing the data for the first time.
How can you turn statistics into a compelling story?
Choose a statistic that answers a real audience question, then explain its context and practical significance. For example, a change in appointment cancellations could prompt a closer look at scheduling patterns and their effect on available time slots. State which period or group the figure covers, and don’t imply a cause unless the evidence supports it. End by naming the decision or question the result raises.
Which chart types work best for different kinds of data?
Match the chart to the comparison: use bars for differences between categories, lines for trends over time, and a pie chart for simple shares of a whole. A dot plot can display individual values, while a scatterplot can show how two measures vary together. If the audience needs to compare exact values, use clear labels rather than relying on color or visual size alone.