

When comparing Power BI vs Excel dashboards, choose Excel for quick analysis, hands-on editing, and reporting built around formulas or PivotTables. An Excel worksheet can contain up to 1,048,576 rows, though the best fit depends on how you work with the data, not just its size. Power BI is better suited to larger datasets, interactive reporting, and combining information from multiple sources.
Both tools turn data into clear visuals, so the choice is not simply about which looks more impressive. Match your dashboard to how you analyze, update, and share information, while keeping reporting consistent as your needs grow.
This guide compares the tools by data volume, analysis, sharing, and governance, then explains when using Excel and Power BI together makes sense. You’ll get a practical way to choose the right setup for your reporting needs.
Key Takeaways
- Match your tool to the scale and shape of your reporting: use Excel for quick, hands-on analysis and consider Power BI for broader, more interactive reporting.
- Assess how people collaborate and where your data comes from to choose a workflow that stays practical as reporting needs evolve.
- Plan sharing and governance around who needs access and how teams will use consistent data and visuals.
- Combine Excel’s familiar analysis tools with Power BI’s interactive reporting, or use an Excel Dashboard Template to create a polished report more efficiently.
Choosing a tool based on dataset size and reporting needs
The Power BI vs Excel dashboards decision depends on data volume, analysis style, and report maintenance. Excel supports hands-on analysis, while Power BI is designed for larger, interactive reports.
Power BI reporting strengths and trade-offs
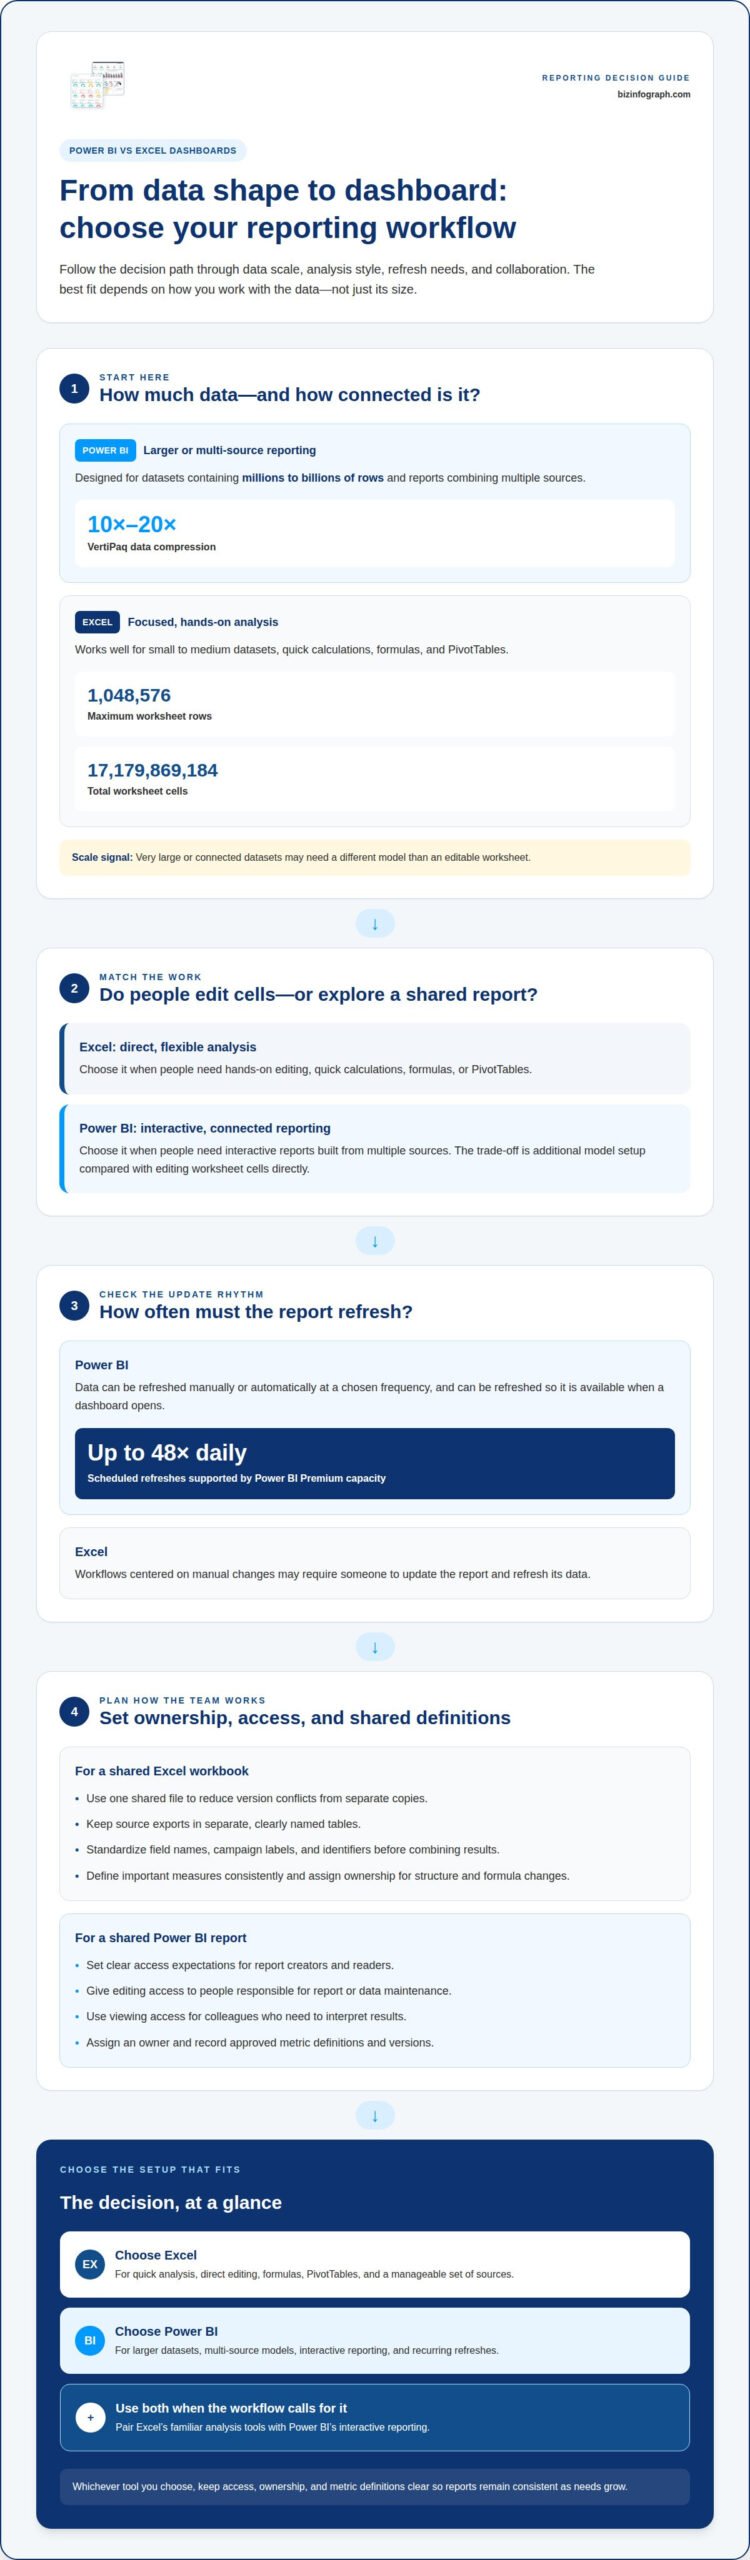
Power BI is designed for large datasets and reports combining multiple sources. Its VertiPaq engine can compress data by 10x to 20x, and it can handle datasets containing millions to billions of rows. In a Power BI vs Excel dashboards comparison, that scale favors Power BI for connected analysis. The trade-off is added model setup compared with editing worksheet cells directly.
Excel reporting strengths and trade-offs
Excel works well for small to medium datasets, quick calculations, and reports built with formulas or PivotTables. A worksheet supports up to 1,048,576 rows and 17,179,869,184 total cells. That capacity covers many focused reporting tasks, while very large or connected datasets may need a different model. Excel’s advantage is flexible, direct editing; its worksheet structure can limit scale.
Data refresh and automation
Refresh needs can help settle the Power BI vs Excel dashboards choice. Power BI can refresh data so it’s available when a dashboard opens, and Power BI Premium capacity supports scheduled refreshes up to 48 times daily. Power BI data can also be refreshed manually or automatically at a chosen frequency. By contrast, workflows centered on manual Excel changes may require someone to update the report and refresh its data.
| Option | Dataset fit | Best suited to | Trade-off |
|---|---|---|---|
| Power BI | Millions to billions of rows | Interactive, multi-source reporting | Needs model setup |
| Excel | Up to 1,048,576 worksheet rows | Quick analysis and flexible editing | Worksheet limits constrain scale |
Choose Excel for direct analysis; choose Power BI when larger data models, recurring refreshes, or interactive reporting matter most.
Excel collaboration and data-source limitations
Excel works well when a marketing team needs to inspect exports and adjust calculations directly. Collaboration gets harder when several people maintain separate workbook copies or change formulas differently. Use one shared file, consistent field names, and a clear owner for key calculations to keep campaign reporting aligned.
For marketing analysis, organize campaign data in a workbook by date, channel, campaign name, and performance measure. A team might keep paid search and email results in separate tables, then use PivotTables to summarize each channel. This suits focused analysis, but repeated exports may need manual cleanup and consistent column names.
Data sources affect the workload. An Excel report based on one CSV export is straightforward to inspect and edit. A workbook using separate advertising, web analytics, and sales exports needs matching fields, such as campaign identifiers, to compare results. If sources label the same campaign differently, standardize the labels to avoid misleading totals.
Excel’s data model can handle more than one flat table. Power Pivot lets users work with multiple tables, define relationships, and write advanced DAX calculations. For example, a campaign table can connect to date and results tables, enabling calculations across related data. This adds flexibility, but requires deliberate relationships and clearly defined measures. Otherwise, contributors may produce conflicting versions of a metric.
- Keep source exports in separate, clearly named tables.
- Standardize campaign names and identifiers before combining results.
- Define important measures, such as conversions, in one consistent place.
- Assign ownership for workbook structure and formula changes.
Use Excel when the team benefits from direct editing and has a manageable set of sources. For recurring marketing reports that combine several platforms, consistent fields and a maintained model are essential. A well-structured workbook helps analysts explore campaign performance; a growing network of sources calls for stronger data modeling and shared reporting practices.
Sharing, security, and governance
The Power BI vs Excel dashboards choice affects how teams publish reports and manage access. In Power BI, build a report from data and share it through your organization’s Power BI environment. In Excel, create the dashboard in a workbook and share it from its storage location. With either tool, decide who can view or edit the report.
Power BI visualizations can draw on multiple data sources and be shared across an organization. This works well when colleagues need a common view of sales, operations, or marketing results. Analysts can maintain the underlying report while managers use its visualizations. Set clear access expectations for report creators and readers.
Excel collaboration centers on the workbook. It can suit a small group reviewing a campaign report or updating a planning sheet. However, separate file copies can create version conflicts: one employee might change a formula while another uses an older workbook. In the Power BI vs Excel dashboards comparison, consider whether people need to edit cells or view a shared report.
Governance also means agreeing on audiences, ownership, and metric definitions. A finance report may need a different audience from a company-wide performance dashboard. Define terms such as “revenue” or “active customer” so teams interpret each measure consistently. Assign an owner to maintain the approved report or workbook and its definitions.
- Give editing access to people responsible for report or data maintenance.
- Use viewing access for colleagues who need to interpret results.
- Assign an owner to each shared report or workbook.
- Record metric definitions and identify the approved version.
Choose Power BI when teams need organization-wide sharing and visualizations across sources. Choose Excel when a smaller group needs to work directly in an editable workbook. The Power BI vs Excel dashboards decision is strongest when it reflects clear ownership, appropriate access, and how colleagues will use the report.
Using Excel and Power BI together
Use Excel for familiar analysis and Power BI to present a connected, interactive view. For plan selection in the United States, first distinguish report creators from viewers, then consider how broadly reports need to be shared and whether organizational capacity is required. These needs shape the right access and deployment arrangement.
A practical workflow starts with an Excel workbook containing clean data ranges, charts, or tables. Power BI can connect to Excel workbooks, display their data, and combine it with information from other sources. For example, monthly sales figures in a workbook can contribute to a report that also includes operational data. Keep field names and measures consistent across sources.
Power BI reports can extend Excel data models with interactive visualizations and natural-language queries. Teams can use an established Excel model as a starting point, then build a broader reporting experience around it. The model remains central: define relationships and calculations clearly before relying on results across connected reports.
The connection also works in the other direction. Users can connect from Excel to Power BI data models, then create PivotTables and charts. Analyze in Excel supports working with Power BI datasets through familiar Excel tools, including slicers. For example, a finance analyst can explore a shared model in a PivotTable without rebuilding its underlying calculations.
- Prepare an Excel workbook with clear tables and consistent column names.
- Connect the workbook to Power BI when reports need combined sources or interactive views.
- Use Excel connected to a Power BI model for PivotTables, charts, and slicers.
- Keep shared measures defined consistently so both tools present aligned results.
This pairing works when teams value Excel’s hands-on exploration and need Power BI’s connected reporting. To build a combined workflow, start with a clear Excel data model, then extend it into Power BI where broader interaction adds value.
Biz Infographs: Excel Dashboard Templates
Biz Infographs offers Excel Dashboard Templates for readers who’ve chosen Excel and want a polished starting point for presenting their data. The templates can reduce design effort as you organize key measures into a clear, decision-ready dashboard. If your reporting needs call for Power BI, Power BI Templates provide a format for that tool. Choose based on where your data lives, how you’ll analyze it, and how colleagues will use the finished report.
For spreadsheet-based reporting, start with a template that fits your data, then adapt its visuals to your measures. This can turn raw rows into a focused view without designing every chart and layout from scratch. Explore Biz Infographs’ Excel Dashboard Templates to find a starting point for your report.
Turn your dashboard choice into a clear next step
Before building, define the decision your dashboard should help someone make. Identify its audience, the measures they need, and how often those measures should change. This gives the layout a practical purpose and keeps new charts focused on useful questions rather than decoration.
Your Power BI vs Excel dashboards decision can evolve as reporting needs change. Start with the workflow that fits today, then extend it when new data sources, collaborators, or analysis needs call for a different approach. The goal is a report people can understand and use with confidence.
For a ready-made starting point, Biz Infographs offers Excel Dashboard Templates, Power BI Templates, and PowerPoint Infographic Templates. Choose the format that supports your next report, or contact Biz Infographs for dashboard support and take the next step with confidence.
Frequently Asked Questions
Which one should you choose?
Choose the tool that fits the report’s audience and what they need to do. Excel is a strong choice when someone needs to change assumptions or inspect individual records. Power BI suits recurring reports where colleagues need to explore the same measures. If both workflows matter, connect Excel analysis to a Power BI model.
What are the main differences between Power BI and Excel dashboards?
The main difference is how each tool organizes analysis and reporting. Excel centers on worksheets, formulas, and direct cell edits; Power BI centers on data models and interactive reports. A spreadsheet can support a one-off budget review, while a Power BI report can present related business measures in a shared visual interface.
When should you use Power BI instead of Excel for dashboards?
Use Power BI when a report needs to combine recurring data from several teams and let viewers explore connected results. A regional sales dashboard, for example, may need consistent measures across locations and an interactive view for managers. Analysts can still use Excel to investigate a specific question, while Power BI presents the agreed reporting view.
How do Power BI and Excel compare for data visualization and interactivity?
Excel charts and slicers suit compact reports where readers filter a table or PivotTable. Power BI supports interactive visualizations that connect views across a report. For example, selecting a product category can help viewers examine related results in other visuals. Choose based on whether readers need a static summary or guided exploration.
How do Power BI and Excel compare when handling large datasets and performance?
Power BI is generally a stronger choice for reports built on extensive, related data, while Excel is convenient for focused analysis. Performance depends on data structure and report design, not just row count. In Power BI, remove irrelevant fields and organize relationships carefully. In Excel, limit the workbook to the data needed for analysis and visuals.
How do Power BI and Excel compare for sharing, collaboration, and access control?
Power BI suits teams that need a shared report with distinct editing and viewing roles. Excel is useful when collaborators must work directly with workbook cells, but multiple copies can complicate version control. For example, a reporting team can maintain a central Power BI view while analysts use Excel to examine details. Set clear ownership and access expectations for both.