Why Retail Dashboards Matter for Sales Analytics
How retail analytics dashboards drive retail success
Retail businesses handle complex retail data every day—sales transactions, inventory movements, promotions, loyalty usage, and customer behavior across online and offline channels. Without a modern data dashboard, store managers and retail leaders spend too much time preparing reports instead of improving performance. A strong retail analytics dashboard provides a single view of the business, helping retail teams track sales performance, store performance, and key retail metrics in real time. Dashboards streamline decision-making by combining data sources like ERP systems, POS systems, and e-commerce dashboards into one place. This makes it easier to analyze performance across stores, detect sales trends early, and support faster decision-making. In short, dashboards help retailers build systems for consistency, visibility, and long-term retail success.
Turning retail data into actionable insights
Retail data becomes valuable only when it turns into action. A dashboard can help with this by converting retail data analytics into clear performance indicators that decision-makers can trust. Dashboards provide retail data into actionable insights such as “which store is underperforming,” “which product categories are improving profit margins,” and “how a promotion affected average basket size.” By using data analytics, the dashboard highlights patterns and exceptions using graphs, KPIs, and real-time insights. This reduces guesswork and supports decisions that improve profitability and customer satisfaction. With embedded analytics and reporting tools, retail teams can react immediately—whether it’s to boost sales, reduce stockouts, or adjust online conversion strategies.
What Makes a Strong Retail Dashboard Template
Must-have retail KPIs for store performance tracking
A strong retail dashboard template must include KPIs that measure performance at store, product, and customer levels. Essential key performance indicators include gross sales, net sales, profit margins, average transaction value, average basket size, conversion rate, units per transaction, and sales per square foot (store performance). For inventory management, track inventory turnover, stock cover days, reorder points, and stockout rates. For promotions, include uplift %, margin impact, and redemption performance. KPI Dashboards should allow store managers to track sales daily and monitor KPI trends per week or month. When retailers track KPIs consistently across stores, retail leaders gain faster decision-making power and clearer business performance control.
Retail dashboard examples and BI visualization best practices
Successful retail dashboard examples show data clearly and guide users toward action. BI dashboards should start with an overview: gross sales, profit margins, inventory health, and top sales trends. Then, allow drilldowns across stores, product categories, time periods, and channels. Retail data visualization should be clean and digestible—avoid clutter and focus on key metrics. Best practice includes consistent color logic for performance (good/neutral/risk), trend graphs for sales performance, and ranking tables for top products and stores. Modern BI tools like Power BI support this through interactive filters. When dashboards are designed properly, they transform turning complex retail data into clear and actionable reporting. This ensures retail teams use the dashboard daily—not only during month-end reporting.
Store Sales Performance Dashboard
Sales KPIs for store performance and retail teams
The Store Sales Performance Dashboard is the most widely used dashboard in retail because it measures the core of retail success: sales. It tracks gross sales, net sales, units sold, average transaction value, average basket, and profit margins at store level. Retail teams use this dashboard to track sales across stores and quickly compare performance between locations. Store managers can spot if sales performance drops due to staffing gaps, product availability, or competitive activity. Retail leaders use the dashboard to support decisions that improve store performance, such as reallocating inventory or adjusting promotions. When combined with real-time data feeds from POS systems, dashboards deliver real-time insights that help retailers act immediately and boost sales.
Retail sales trends and product category analytics
Sales trends are just as important as totals. Retail dashboard analyzes sales trends over time and breaks them down by product category, brand, SKU, and seasonality. Retail leaders can identify which categories are growing and which are declining, helping optimize assortment and pricing strategy. Dashboards also reveal the impact of promotions on different categories and whether promotions improve sales volume or only reduce margins. When retail data analytics is connected to a data warehouse, category dashboards become more powerful, showing long-term trends and demand shifts. This helps retailers improve data-driven decisions such as product lineup planning, supplier negotiations, and markdown strategy. Turning complex retail data into actionable insights begins here—by clearly visualizing which categories drive revenue and profitability.
Inventory & Stock Control Dashboard
Inventory KPIs for retail analytics reporting
Inventory management is one of the biggest drivers of retail profitability. The Retail Inventory & Supply Chain Dashboard tracks inventory turnover, stock levels, out-of-stock rate, overstock risk, days of inventory, and purchase order status. This retail analytics reporting template helps retailers prevent missed sales caused by stockouts and avoid waste caused by slow-moving inventory. It also supports supply chain tracking across stores, warehouses, and vendors. Retail teams can monitor inventory KPIs daily using real-time data from ERP systems and POS systems. A dashboard provides visibility into inventory issues early, enabling better reordering decisions. With strong data models, retailers can combine sales and inventory data into a single view to optimize stock allocation across stores.
Preventing stockouts and improving turnover
Stockouts kill sales—and overstock kills cash flow. A good inventory dashboard shows which products risk becoming out-of-stock and which items are becoming slow-moving. It helps retailers maintain product availability while optimizing turnover. For example, if one store runs out of fast-selling items while another has excess stock, dashboards guide immediate inventory transfers. With real-time insights and embedded analytics, inventory decisions become faster and more accurate. Inventory dashboards also support promotion planning by ensuring enough stock is available to meet demand spikes. Retail leaders use this dashboard to improve turnover rate, reduce carrying costs, and maximize profitability. This is where dashboards and reports directly impact results—because smarter inventory decisions lead to better margins and retail success.
Customer & E-commerce Analytics Dashboard
Retail dashboard examples for customer behavior insights
Understanding customers is essential for sustainable retail growth. The Retail Customer Insights Loyalty Dashboard helps retailers analyze customer data, shopping frequency, repeat purchase behavior, average basket size, loyalty enrollment, and segment profitability. This dashboard turns customer insights into actionable retail strategies—targeted promotions, retention campaigns, and product recommendations. Retail teams can identify patterns: which customer groups respond to promotions, which products drive repeat buying, and what causes churn. With complex retail data, customer dashboards must be built with proper data quality controls, data security, and access restrictions. When connected to multiple systems (POS systems, CRM, loyalty apps), the dashboard provides one view of the customer journey and helps retailers make smarter decisions that improve loyalty and long-term business performance.
E-commerce dashboards for conversion and online sales
Retail growth increasingly depends on online channels. This e-commerce dashboard template tracks online sales performance, conversion rate, cart abandonment, traffic sources, product page views, and checkout issues. Dashboards help retailers compare online and offline performance in one platform, enabling omnichannel strategy. By analyzing customer behavior online, retailers can optimize promotions, improve product listings, and increase conversion rates. When dashboards combine sales and customer data, they reveal which products generate the highest online basket values and which campaigns drive profitable customer acquisition. E-commerce dashboards also require strong data engineering to connect data sources like web analytics,predictive analytics, ERP, and payment systems into reliable data models. A dashboard provides retail leaders with real-time insights to boost sales and strengthen digital retail success.
Retail Executive KPI Overview Dashboard
Executive KPIs for retail success decision-making
Executives and retail leaders need dashboards that summarize performance clearly. This template includes high-level KPIs: gross sales, profit margins, inventory health, customer retention, and store performance trends. The goal is to support faster decision-making by presenting the business in a concise overview. An executive dashboard helps retail leaders track key performance indicators across stores and channels and quickly identify where action is required. For example, if margins drop, the dashboard highlights whether it is caused by promotions, shrinkage, or supply chain cost changes. This supports decisions that improve profitability and business performance. When built in Power BI, executives can drill down from KPIs into store-level details without requesting new reports.
BI dashboards for actionable reporting and strategy
A BI dashboard is not just a reporting tool—it is a decision engine. BI dashboards support advanced data analytics by connecting data warehouse systems, ERP, POS, e-commerce, and finance systems. Dashboards provide actionable reporting by showing what happened, why it happened, and what corrective actions are needed. For example, BI dashboards can highlight which stores need staffing adjustments, which product categories require markdown changes, or which customer segments should receive targeted offers. Retail teams can create custom dashboards and tailor views for different roles. With embedded analytics, dashboards become part of the daily workflow—not separate reports. By enabling users to create custom insights, BI dashboards help retailers make informed decisions faster and execute better strategies that increase profitability.
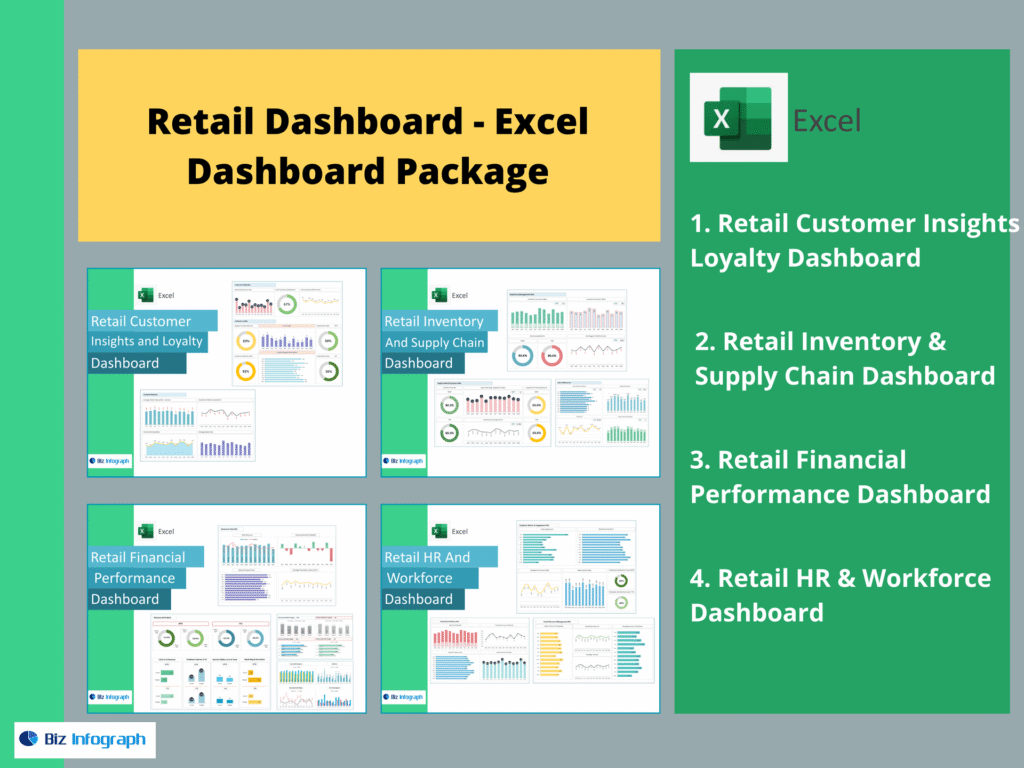
The 4 Dashboards Included in This Retail Package
This retail dashboard package includes: Retail Customer Insights Loyalty Dashboard, Retail Inventory & Supply Chain Dashboard, Retail Financial Performance Dashboard, and Retail HR & Workforce Dashboard. Together, these dashboards provide one view across customers, inventory, finances, and workforce performance—helping retailers convert complex retail data into actionable insights, streamline reporting, and make data-driven decisions that improve sales and profitability.
For ready-to-use Dashboard Templates: