Why Education Dashboard Matter for Administrators
How education dashboards support data-backed decision-making
School administrators manage many moving parts—student performance, enrollment, staffing, attendance, and budgets. Without a dashboard, decision-making becomes reactive and time-consuming. A well-designed education dashboard centralizes critical data and supports data-backed decision-making by turning academic data into clear graphs and performance insights. Instead of manually reviewing multiple reports, school administrators can quickly access student data, track student outcomes, and identify areas needing attention. Dashboards help interpret complex data by providing color-coded KPIs and key metrics in a user-friendly interface. With built-in access management and data privacy controls, dashboards also ensure sensitive student management data is protected. Ultimately, dashboards enable school leadership to make informed decisions proactively and improve academic success.
Turning school analytics into performance insights
Modern schools generate huge volumes of data sets—grades, assessments, attendance, discipline, student enrollment, teacher workload, and more. School analytics becomes valuable only when administrators can turn raw information into actionable insights. Dashboards provide performance insights by using data analysis to identify patterns: declining scores in specific subjects, increasing absenteeism, or growing at-risk student groups. A dashboard is designed to streamline how schools monitor key performance indicators and track student progress. Administrators can analyze key metrics over time and detect early warning trends, which supports proactive interventions. With dashboards designed for school management systems, leadership can gain insights seamlessly and drive better outcomes across students and teachers.
What Makes a Strong Education Dashboard Template
Key features of the education dashboard template
A strong dashboard template must be ready-made, user-friendly, and scalable. The best templates are out-of-the-box, meaning administrators can implement quickly without complex development. Key features of the education dashboard include a clear UI layout, dashboard example pages, and built-in KPI widgets for quick review. It should allow school administrators to track student outcomes, staff KPIs, and resources without switching between tools. Templates should also support data privacy through access management settings and validation rules. Because schools have different use cases, dashboards should be customizable with filters and views for principals, department heads, and academic coordinators. A dashboard provides a single screen for critical data, helping leadership quickly access the most important metrics.
Must-have KPIs and key performance indicators
Education dashboards must focus on practical, measurable KPIs. Core key performance indicators include student performance averages, pass/fail rates, literacy/numeracy trends, graduation readiness, attendance rates, and student engagement. Dashboards should also track enrollment changes, dropout risk, and at-risk student alerts. Operational KPIs could include teacher-to-student ratio, classroom utilization, and workflow efficiency. By highlighting key metrics, dashboards enable administrators to identify areas for improvement and allocate resources intelligently. Using color-coded visuals, admins can spot problems early and respond quickly. The most effective dashboards are data-driven and ensure accuracy through validation rules and consistent data sources, which supports reliable school-wide reporting.
Customization options for different schools and roles
Every school is different, so customization options are critical. A customizable dashboard template allows administrators to create custom views based on role—principal, vice principal, head of academics, or finance manager. Customize options include adjusting KPI thresholds, changing graph layout, selecting specific data sets, and adding additional widgets such as enrollment charts or performance distribution. A dashboard enables users to filter by grade level, program type, teacher group, or subject area to interpret complex data more easily. Templates should also support APIs for data sources and seamless integration into school management systems or SaaS platforms. With customize options, the dashboard becomes scalable and aligned with specific needs, producing better outcomes and easier decision-making.
Student Performance & Academic Insights Dashboard
Performance insights for grades, exams, and learning outcomes
The first template in this package is the Academic Performance and Student Engagement Dashboard. It focuses heavily on tracking student performance, academic outcomes, and learning progress. This dashboard provides performance insights through graphs showing grades distribution, test results, subject-level trends, and class comparisons. Administrators can track student performance over time and quickly identify patterns such as declining math performance or reading gaps in certain grades. With student data centralized, school administrators can drill down to specific data such as subject scores, assessment results, and student outcomes. This dashboard example makes academic data actionable by showing areas requiring targeted intervention. It also supports academic success by enabling proactive planning instead of reactive reporting.
KPI tracking for academic improvement planning
Academic improvement requires strong KPI tracking and actionable insights. This dashboard template includes KPI widgets for subject performance, average score trends, pass rates, learning outcome completion, and progress for at-risk students. School administrators can analyze key metrics to identify areas for improvement, such as low-performing grade cohorts or subject weaknesses. By tracking student performance regularly, administrators can build targeted strategies—extra tutoring, teacher training, curriculum revision, and student support programs. The dashboard enables effective planning because it shows accurate data in a visual, user-friendly interface. When paired with regular updates, the dashboard becomes a proactive tool for achieving better outcomes. The best practice is to review this dashboard weekly and use insights to drive corrective workflow actions.
Attendance & Student Engagement Analytics Dashboard
Attendance KPIs and risk alerts for early intervention
Attendance is one of the strongest predictors of academic success. This dashboard template includes attendance KPIs such as daily attendance rates, chronic absenteeism, late arrivals, and attendance trends per month. The dashboard is designed to generate risk alerts by flagging students who are becoming at-risk due to absentee patterns. With color-coded indicators, administrators can quickly access critical data and prioritize interventions. This dashboard also supports workflow automation: attendance reporting can be automated from school management systems or APIs instead of manual entry. By tracking student attendance in real time, school administrators can proactively act—engaging parents, counselors, and teachers early. Early intervention improves academic outcomes and prevents long-term performance decline.
Engagement analytics and school-wide performance insights
Engagement analytics goes beyond attendance. This dashboard template tracks student engagement indicators such as participation trends, assignment completion rates, behavior incidents, and student involvement in activities. Engagement data is critical because students may attend school but still disengage academically. Dashboards provide school-wide performance insights by combining engagement data with academic performance. Administrators can identify patterns—such as engagement drop-offs during exam seasons or differences between grades. This dashboard example supports students and teachers by providing actionable data-driven insights on engagement trends. With a user-friendly interface, administrators can interpret complex data quickly and identify areas requiring attention. These insights help schools improve engagement strategies and achieve better outcomes.
Staff Performance & Operations Dashboard
Staff KPIs, workload tracking, and operational analytics
Schools are operational systems, and staff effectiveness impacts academic success. This template focuses on HR and operational performance, aligned with the Human Resource Education Sector Dashboard. It tracks staff KPIs like workload distribution, teacher-to-student ratio, absenteeism, substitute teacher usage, overtime hours, and performance reviews. By monitoring workflow efficiency, school management can ensure resources are balanced and burnout risks are reduced. Dashboards provide operational analytics by highlighting patterns such as staffing shortages in specific departments or increased overtime due to scheduling issues. This dashboard also supports student management by ensuring teachers are properly allocated across programs. With critical data in one place, administrators can optimize staffing decisions and improve daily operations.
Dashboard customization for principals and department heads
A single dashboard must serve multiple leadership levels. Principals need school-wide operational insights; department heads need detailed subject-level staffing and performance metrics. This dashboard template supports customization options so each leader sees specific data relevant to their needs. For example, principals may view staffing KPIs by grade, while department heads may focus on teacher workload and student outcomes in particular subjects. The UI and layout should remain user-friendly while allowing drill-down graphs for deeper analysis. The dashboard enables leadership to make informed decisions by quickly accessing accurate data and identifying areas of improvement. These dashboards designed for education also include access management to ensure data privacy—only approved users can view staff performance details.
Education Finance & Budget KPI Dashboard
Budget KPIs, spending tracking, and resource allocation
The Education Sector – Finance Dashboard is essential for administrators managing school budgets, funding programs, and expense control. This dashboard template includes budget KPIs like spending vs budget, category-wise expenses, resource allocation by department, and forecasted cash needs. Schools often have tight budgets, so dashboards help leadership monitor costs proactively instead of discovering overspending at year-end. This dashboard provides visibility into school operations spending—classroom supplies, IT spending, facility maintenance, professional development, and extracurricular activities. Administrators can analyze key metrics and identify areas for improvement, such as cost overruns in specific categories. A dashboard provides the financial clarity needed to allocate resources strategically and support better educational outcomes.
Data-backed reporting for administrators and stakeholders
Education reporting does not stop at internal review—schools must communicate with stakeholders such as boards, parents, government agencies, and funding bodies. This dashboard template supports data-backed reporting by presenting concise, digestible visuals showing performance metrics, budget health, and strategic progress. Dashboards enable administrators to prepare stakeholder reports quickly by using consistent graphs and standardized KPIs. Built-in validation rules improve accuracy, and data privacy controls ensure sensitive information is protected. When reporting becomes consistent and transparent, trust improves. A finance dashboard also supports scenario planning: if enrollment changes, administrators can adjust budgets and resource planning. This ensures financial decisions remain aligned with student success goals.
How to Implement Dashboard Templates Successfully
Setup steps, data sources, and dashboard template configuration
Successful implementation requires clean data and structured setup. First, identify data sources—academic data, student enrollment data, attendance systems, staff HR records, and financial accounting records. Many school management systems support APIs, allowing dashboards to pull data seamlessly. Next, configure dashboard templates to map the right data sets into KPIs. Use validation rules to ensure accurate data, especially for enrollment counts and grade scores. Access management should be configured early to ensure data privacy for student management records. Schools can implement dashboards as SaaS tools or in-house BI systems. With out-of-the-box templates, setup becomes faster: admins can quickly access dashboard example views, modify filters, and create custom dashboards aligned with their needs.
Best practices for maintaining accurate KPI dashboards
Dashboards require regular updates to remain trustworthy. Best practices include scheduling weekly data refresh, monthly KPI reviews, and quarterly audit checks. School administrators should maintain data governance: define who owns data sources and who approves KPI changes. Track changes in key metrics carefully and ensure consistent definitions of performance indicators across departments. Dashboards should be scalable—able to include multiple dashboard pages as schools grow. Regular updates should include UI improvements, new graph types, and additional actionable insights based on new use cases. If data quality issues occur, administrators must correct them quickly to maintain trust. When dashboards remain accurate, schools gain continuous insights, enable data-driven decision-making, and achieve better outcomes.
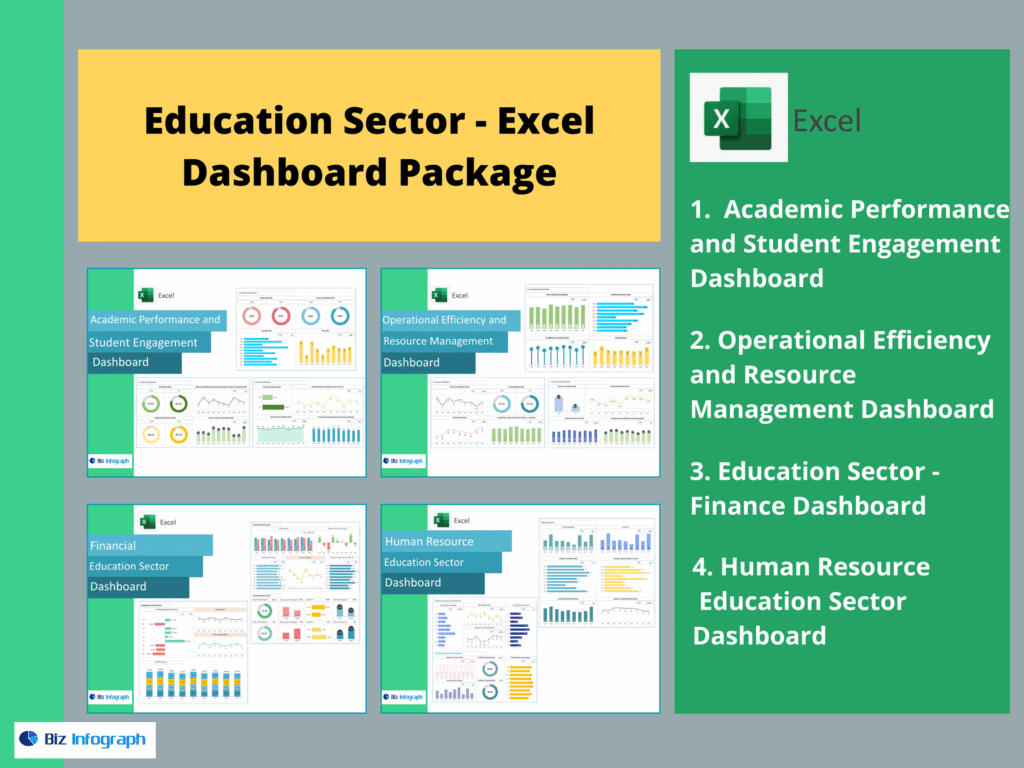
The 4 Dashboards Included in This Education Package
This education dashboard package includes multiple dashboard templates for administrators, including: Academic Performance and Student Engagement Dashboard, Operational Efficiency and Resource Management Dashboard, Education Sector – Finance Dashboard, and Human Resource Education Sector Dashboard. Together, they deliver a complete school analytics ecosystem—supporting student performance tracking, operations workflow analytics, financial reporting, and HR workforce planning with scalable, customizable, and data-driven dashboards.
For ready-to-use Dashboard Templates: