Why IT And Software Reporting Dashboards Matter
How dashboards help software development teams report faster
In modern software development, speed matters—but reporting is often slow because data sits in multiple tools. Teams might track tickets in Jira, deployments in GitHub, monitoring in Datadog, and customer usage in product analytics tools. Without a single dashboard, people manually prepare updates and waste time translating raw data into leadership-friendly reporting. A modern dashboard improves dashboard reporting by consolidating users and data into one view. With a KPI dashboard, software teams can instantly visualize sprint performance, backlog status, release frequency, and delivery risks. Dashboards also help identify patterns in data such as repeated blockers or unstable release cycles. With dashboard templates and dashboard creation tools, teams can turn your data into actionable reporting faster—especially when dashboard software pulls data from multiple sources automatically.
Turning data analysis into clear KPI dashboard insights
Raw data is not useful until it becomes insight. IT and software organizations generate complex data from monitoring tools, service desk software, cloud logs, and deployment pipelines. The best dashboards convert raw data into clear KPI insights using effective data visualization. A dashboard and reporting approach helps leadership understand dashboard performance across uptime, incident resolution, customer churn, and system capacity. With deeper data analysis, dashboards reveal where service delivery is failing and where teams should optimize. Strong dashboarding software supports patterns in data, allowing you to spot trends across weeks or quarters. When you turn your data into actionable insights, reporting becomes decision-making—helping teams reduce downtime, improve user experience, and scale sustainably.
What Makes the Best Dashboard Software for Reporting
Key features of the best dashboard software options
Choosing the right dashboard software is critical because dashboards are only as good as the tools behind them. The best dashboard software options should support connecting multiple data sources, including data sources like databases, spreadsheets, cloud services, and APIs. The right dashboard software should also offer strong dashboard builder features, scheduling, role-based access, and interactive filtering. Many dashboard software platforms include templates and dashboard creation workflows that reduce setup time. For enterprise reporting, the tool must handle complex data and large data volumes. For small businesses, dashboards must be simple and fast to implement with data with minimal engineering. In short, the best dashboard software and tools help users and data teams collaborate to build compelling data stories from specific data.
Interactive dashboard and data visualization essentials
An interactive dashboard is essential for real reporting, not just static charts. Interactive dashboards allow teams to drill down from summary KPIs to deeper data by system, team, product, region, or time range. Data visualization is what makes reporting understandable to non-technical stakeholders. Best practice dashboards use charts, KPI cards, trend lines, funnel views, and heatmaps to display patterns in data clearly. A modern dashboard should combine data from multiple sources into one visual system and allow rapid filtering. With dashboard software transforms raw data into reporting-ready visuals, leaders can ask questions and get answers instantly—without exporting data. Whether using tools like Power BI or other BI tools, good visualization helps turn your data into actionable reporting outcomes.
Dashboard builder vs dashboard tool: what to choose
Many organizations confuse a dashboard builder with a dashboard tool. A dashboard builder is focused on creating dashboards—drag-and-drop visuals, templates, and layout design. A dashboard tool often includes broader features like ETL, alerts, analytics, data modeling, and collaboration. If you need to connect data from various data sources, model it, and run deeper data analytics, you may need a full dashboarding tool, not only a builder. However, for small businesses, a dashboard builder paired with dashboard templates may be enough to create a single dashboard from spreadsheets quickly. The best dashboarding choice depends on your users and data maturity: do you need advanced integrations, or do you need fast dashboard reporting with minimal setup?
IT Operations KPI Dashboard
IT reporting KPIs to visualize performance
An IT Operations KPI Dashboard is essential for reliability reporting. IT teams need clear KPIs to understand availability, incident response, and service health. This dashboard helps visualize uptime, downtime minutes, mean time to detect (MTTD), mean time to resolve (MTTR), ticket backlog, and SLA compliance. It also supports IT leadership by turning complex data into a clear operational picture. Patterns in data become obvious—like recurring outages on specific days or incident spikes after deployments. A KPI dashboard also improves accountability by showing team-level performance trends. Whether you’re using best custom dashboard software or free dashboard options, a strong IT and Software reporting dashboard is a foundation for operational excellence and consistent service delivery.
Connecting multiple data sources for real-time reporting
IT operations reporting requires data from multiple sources: monitoring tools, ticketing systems, cloud services, and databases. The best dashboards connect data from different sources and combine data into one view. When dashboard software pulls data automatically, it enables a real-time reporting experience. With software pulls data from multiple services—alerts, incident logs, and user tickets—leaders can see real-time trends and prevent problems proactively. Dashboards that connect multiple data sources reduce manual reporting and improve accuracy. A dashboard software platform that supports various data sources like databases, data from spreadsheets, and data from tools like monitoring and ITSM systems creates a true source of truth. The result is a single dashboard that supports reporting for leadership, IT teams, and stakeholders.
Software Development Performance Dashboard
Software development metrics for reporting dashboards
A Software Development Performance Dashboard helps teams measure delivery performance and engineering productivity. It tracks sprint velocity, cycle time, lead time, deployment frequency, bug rates, code review times, and release stability. For reporting, this dashboard is powerful because it translates software development activity into business outcomes. Teams can identify patterns in data—like recurring rework, unstable modules, or bottlenecks in QA. A modern dashboard also supports dashboard reporting across multiple squads and products, giving leadership visibility without micromanaging. This type of dashboard and reporting system is increasingly needed as organizations adopt DevOps and continuous delivery. By using dashboard templates, teams can standardize reporting without reinventing metrics for each project.
Using templates in Microsoft Excel and Power BI
Many teams start with templates in Microsoft Excel because Excel is flexible and fast. Excel dashboard templates can handle data from spreadsheets and basic exports from project management systems. But when reporting grows, tools like Microsoft Power BI become the best dashboarding option because Power BI supports multiple data sources, automated refresh, and interactive drilldowns. Tools like Power BI help users and data teams create a dashboard that scales beyond a single file. Power BI can combine data from multiple sources—GitHub, Jira, CI/CD pipelines, and databases—and turn your data into actionable insights. If you need dashboard performance reporting that’s reliable and scalable, Microsoft Power BI is one of the best dashboard software platforms for both enterprise and growing teams.
Enterprise Executive Reporting Dashboard
Best for enterprise reporting and decision-making
Enterprise leaders need dashboards that focus on outcomes, not technical details. An Executive Reporting Dashboard consolidates data analytics across IT operations, engineering delivery, financial performance, and talent. This dashboard is best for enterprise because it combines data across multiple business units and systems. It provides KPI snapshots: uptime status, delivery timelines, budget vs actual, team capacity, and strategic milestones. What makes it powerful is that it turns your data into actionable executive reporting. It enables leadership to review project health, delivery risk, and service stability without needing technical deep dives. With dashboard software transforms raw data into clear executive visuals, reporting becomes faster, more consistent, and aligned with decision-making.
Best custom dashboard software for leadership reporting
Enterprise reporting often requires best custom dashboard software because leadership dashboards must match company strategy and governance requirements. Best custom dashboard software supports complex data modeling, strong security, and integrations across data from various sources. These dashboard software platforms allow organizations to create a single dashboard for executives while still providing drilldown dashboards for managers. The best dashboard software and tools help build compelling data stories using patterns in data, alerts, and interactive charts. Leadership can view insights from your data and compare performance across projects, departments, or regions. When dashboard creation is standardized through templates and governance, reporting becomes more reliable—especially when software pulls data from multiple enterprise systems automatically.
Marketing & Product Analytics Reporting Dashboard
Best for marketing dashboards and KPI tracking
Software growth depends on marketing and product analytics. A marketing dashboard helps track leads, conversions, customer acquisition cost (CAC), funnel performance, and engagement. This dashboard is best for marketing teams because it centralizes KPI reporting across campaigns, channels, and customer journeys. It also supports product teams by highlighting user onboarding completion, feature adoption, retention, and churn signals. By tracking patterns in data, teams can identify which campaigns produce high-quality users and which generate low retention. A KPI dashboard provides clarity and alignment between marketing efforts and revenue goals. In reporting, this dashboard allows stakeholders to see the impact of growth strategies and adjust budgets quickly based on data analytics.
Data sources and visualization for software growth
Marketing and product dashboards depend heavily on integrating multiple data sources. Common data sources like Google Analytics, CRM systems, ad platforms, and product analytics tools must be connected. Dashboards should connect data from google analytics, data from tools like HubSpot or Salesforce, and data from different sources like app telemetry databases. When dashboard software pulls data from multiple sources into one dashboard, it becomes possible to visualize the full funnel—from clicks to revenue. Strong visualization includes funnel charts, cohort retention graphs, and channel comparisons. This approach turns raw data into clear growth reporting. With data into one dashboard, teams gain key insights into which actions drive growth, making it easier to scale campaigns and improve customer acquisition efficiency.
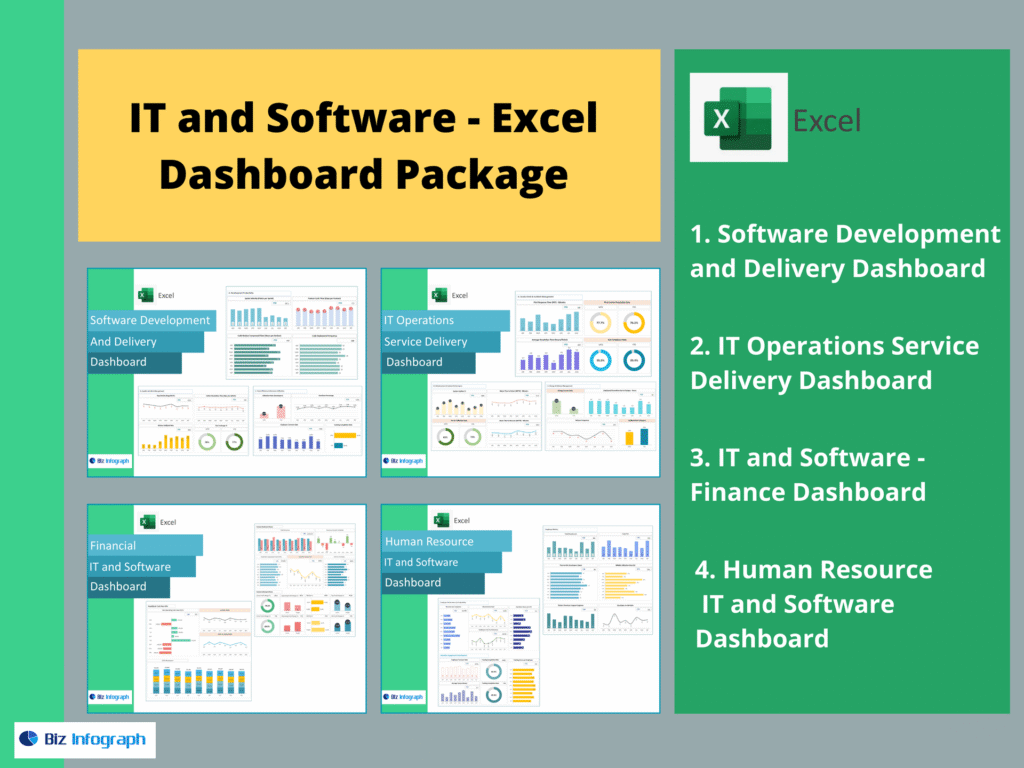
The 4 Dashboards Included in This IT & Software Package (as requested)
A complete IT and software reporting setup should include these four dashboards: Software Development and Delivery Dashboard, IT Operations Service Delivery Dashboard, IT and Software – Finance Dashboard, and Human Resource IT and Software Dashboard. Together, they create a single dashboard ecosystem that connects data from multiple sources, improves dashboard reporting, supports performance management, and turns raw data into actionable insights across delivery, operations, finance, and people metrics.
For ready-to-use Dashboard Templates: