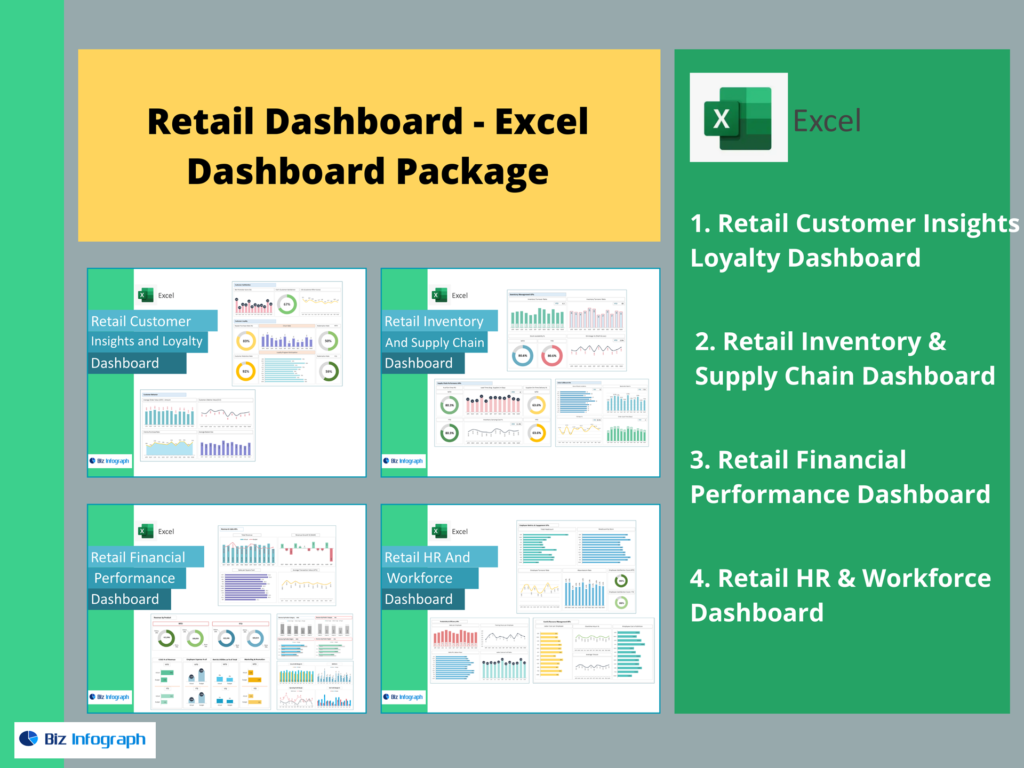
Overview of the Retail Dashboard Package
What a Retail Dashboard Is and How It Supports Retailers
A retail dashboard is a centralized dashboard that consolidates sales, inventory, customer, and operational data into a single, visual interface. For any retail business—whether brick-and-mortar, e-commerce, or omnichannel—this dashboard serves as a critical management and analytics tool. Retail dashboards turn complex retail data into clear, actionable insights that retail leaders and teams can understand quickly.
A well-designed dashboard can help retailers track store performance, monitor gross sales and gross margin, and evaluate business performance across locations and channels. By pulling data from multiple sources such as ERP systems, POS platforms, and e-commerce tools, dashboards provide a unified view of operations. This enables faster decision-making, improved coordination, and stronger retail success in competitive markets.
Using Analytics and Retail Data in a Retail Dashboard
Retail dashboards rely heavily on data analytics and retail data analytics to generate meaningful insights. Raw retail data alone has limited value; analytics transforms it into intelligence that supports daily and strategic decisions. Retail dashboards analyze sales-related data, inventory levels, customer interactions, and conversion rates to reveal performance patterns.
By integrating data from a data warehouse, ERP systems, and SQL-based sources, dashboards ensure consistency and accuracy. Retail data analytics helps retailers understand trends, identify anomalies, and forecast demand. This analytical approach allows retail teams to make data-driven decisions instead of relying on intuition, improving both short-term execution and long-term planning.
Retail Dashboard Examples for Retail Success
Retail dashboard examples illustrate how dashboards are applied across different retail scenarios. Examples often show store performance comparisons, sales trends by SKU, inventory turnover, and customer retention metrics. These examples demonstrate how dashboards provide visibility into performance across locations, categories, and channels.
By reviewing retail dashboard examples, retailers can identify best practices in data visualization and KPI selection. Examples also highlight how dashboards turn complex retail data into actionable insights that drive retail success. Seeing how other retailers use dashboards helps organizations design dashboards that fit their specific retail needs.
KPIs, Metrics, and Retail Performance
Key KPIs and Metrics Tracked in a Retail Dashboard
Retail dashboards focus on key performance indicators (KPIs) that reflect sales, profitability, and operational efficiency. Common key retail metrics include gross sales, gross margin, conversion rate, average basket size, average transaction value, and inventory levels. These KPIs provide a clear picture of retail performance.
By tracking KPIs consistently, retailers can identify performance gaps and opportunities. Dashboards allow teams to track KPIs over time and compare performance across stores or channels. This structured KPI approach ensures that retail teams focus on metrics that truly impact business sales performance.
KPI Dashboard for Monitoring Retail Performance
A KPI dashboard centralizes retail KPIs into a single, easy-to-understand view. It enables retail leaders to monitor performance in real time and respond quickly to changes. KPI dashboards help track key performance indicators such as sales trends, profit margins, and inventory health.
With real-time data and interactive dashboards, KPI dashboards support faster decision-making. Retail teams can drill down into metrics to identify areas that need attention. This visibility empowers teams to take corrective actions before issues escalate, improving overall retail operations performance.
Turning Retail KPIs into Actionable Insights
The real value of a retail dashboard lies in turning KPIs into actionable insights. Dashboards don’t just display numbers; they provide context and trends that guide action. By combining KPIs with data visualization, dashboards make it easier to understand what’s happening and why.
Actionable insights help retailers optimize pricing, adjust inventory, and refine marketing strategies. By turning retail data into actionable insights, dashboards enable retailers to make smarter decisions that directly impact sales, customer satisfaction, and profitability.
E-Commerce and Omnichannel Dashboards
E-Commerce Dashboards for Online Retail Performance
E-commerce dashboards are a critical component of a retail dashboard package. They track online sales, conversion rate, customer interactions, and digital marketing performance. For retailers with online channels, these dashboards provide visibility into e-commerce performance in real time.
E-commerce dashboards integrate data from online platforms, analytics tools, and ERP systems. They help retailers understand customer behavior, customer data, monitor sales trends, and optimize digital strategies. By providing real-time insights, e-commerce dashboards support faster adjustments and improved online performance.
Using Retail Data to Analyze E-Commerce Success
Retail data analytics plays a key role in analyzing e-commerce success. Dashboards combine sales data, customer interactions, and traffic metrics to evaluate performance across digital channels. This analysis helps retailers identify which products, campaigns, and channels drive results.
By using predictive analytics, dashboards can forecast demand and anticipate changes in customer behavior. This capability supports proactive decision-making and inventory planning. Retail dashboards thus become strategic tools for scaling e-commerce operations successfully.
Retail Dashboards for Omnichannel Retailers
Omnichannel retailers need dashboards that unify data across online and offline channels. Retail dashboards consolidate data from stores, e-commerce platforms, and customer touchpoints to provide a complete performance view.
These dashboards help retailers track performance across channels, understand cross-channel customer behavior, and improve customer retention. By integrating data from multiple sources, omnichannel dashboards support coordinated strategies and consistent customer experiences.
Dashboard Software and Customization
Dashboard Software for Building Retail Dashboards
Dashboard software is the foundation of any retail dashboard package. Modern dashboard software integrates with analytics platforms, data warehouses, and ERP systems to deliver real-time insights. Tools such as Power BI enable interactive dashboards and advanced data visualization.
Good dashboard software supports scalability, data security, and data quality. It allows retailers to handle large volumes of data efficiently and maintain reliable reporting. Choosing the right dashboard software is essential for long-term success.
Tailor Retail Dashboards to Specific Retail Needs
Retail dashboards must be tailored to fit specific retail models and goals. A grocery retailer’s dashboard differs from a fashion retailer’s or an electronics retailer’s dashboard. Customization ensures relevance and usability.
Modern tools allow users to create custom dashboards without heavy technical effort. Retail teams can tailor dashboards to focus on specific SKUs, regions, or performance metrics. This flexibility improves adoption and ensures dashboards deliver value.
Creating Actionable Retail Dashboards with Analytics
Creating actionable dashboards requires combining analytics, data visualization, and business context. Dashboards should highlight insights that drive action rather than overwhelm users with data points.
By leveraging analytics solutions and interactive dashboards, retailers can focus attention on areas that need improvement. Actionable dashboards support faster decision-making and better outcomes across the retail organization.
Driving Retail Success with Dashboards
How Retail Dashboards Deliver Actionable Insights
Retail dashboards deliver actionable insights by presenting data in a clear, visual format. They help retailers identify trends, detect anomalies, and understand performance drivers.
Dashboards offer real-time insights that enable quick responses to changing conditions. This capability supports operational agility and improves retail success.
Using Retail Dashboards to Improve Retail Success
Retail dashboards improve retail success by supporting data-driven decision-making. They empower retail leaders to monitor performance, optimize operations, and enhance customer experiences.
By tracking KPIs and analyzing trends, dashboards help retailers stay competitive and profitable. Retail success increasingly depends on the ability to use data effectively, and dashboards are central to that effort.
Retail Dashboard Packages for Data-Driven Decision Making
A Retail Dashboard Package brings together dashboards, analytics, and reporting tools into a cohesive solution. These packages support data-driven decisions across the retail business.
By consolidating data from multiple sources and turning it into actionable insights, dashboard packages help retailers drive strategic decisions, improve operational efficiency, and achieve sustainable growth.
Conclusion
A Retail Dashboard Package is an essential solution for modern retail businesses. By combining retail analytics, real-time data, and powerful visualization, dashboards transform complex retail data into actionable insights. They empower retailers to track performance, understand customer behavior, and make smarter, faster decisions that drive retail success.
For ready-to-use Dashboard Templates: