Overview of the Real Estate Dashboard Package
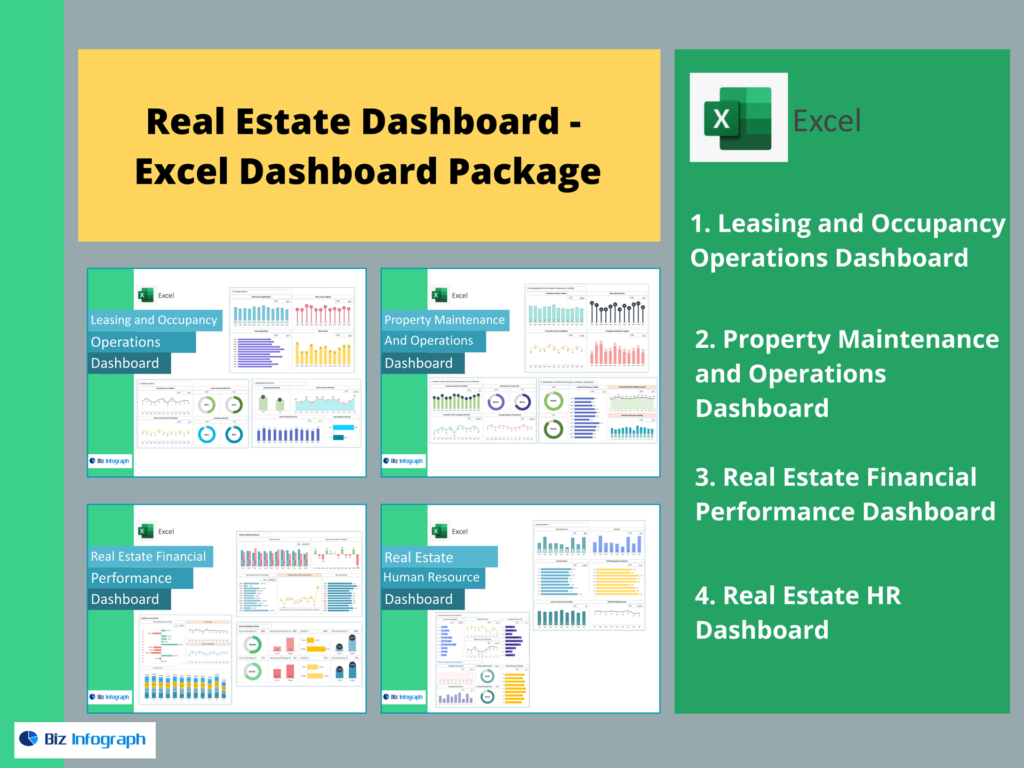
What a Real Estate Dashboard Is and Why Real Estate Businesses Need It
A real estate dashboard is a centralized dashboard that consolidates critical real estate data into a single, easy-to-understand interface. For real estate businesses operating in the residential, commercial real estate, or mixed-use segments, dashboards provide visibility into property performance, occupancy, financial outcomes, and portfolio trends. Without a dashboard, data is often scattered across spreadsheets, property databases, CRM systems, and management software, making analysis slow and error-prone.
A modern dashboard helps real estate organizations monitor key performance indicators, visualize trends, and make data-driven decisions. It transforms raw real estate data into actionable insights that support strategic decisions. By offering a clear view of performance across property portfolios, dashboards empower managers, investors, and executives to stay informed and competitive in the real estate sector.
All-in-One Dashboard Solutions for Real Estate Management
An all-in-one real estate dashboard package combines multiple dashboard types—financial, sales, operational, and portfolio dashboards—into a single management system. These solutions integrate dashboard software with real estate management tools, CRM platforms, and BI systems to deliver a unified experience. Instead of switching between multiple tools, users gain a comprehensive view of operations in one place.
All-in-one dashboard solutions streamline operations for property managers by consolidating data across leasing, maintenance, finance, and asset management. By pulling data from multiple sources, these dashboards ensure accuracy and consistency. The result is improved operational efficiency, better oversight, and faster access to insights across property portfolios.
Dashboard Examples for Real Estate Business Performance
Dashboard examples help real estate organizations understand how dashboards can be applied to real-world scenarios. Examples typically include visualizations of occupancy rate, net operating income, agent performance, and portfolio performance. These examples show how dashboards provide a clear picture of property health and financial outcomes.
By reviewing dashboard examples, real estate investors and managers can identify the right dashboard design and metrics for their needs. Examples highlight how dashboards consolidate data into intuitive visualizations, making it easier to track performance and uncover trends. They also demonstrate best practices in data visualization and KPI tracking.
Property Management and Portfolio Performance
Property Management Dashboard for Occupancy and Property Performance
A property management dashboard focuses on operational metrics such as occupancy, lease status, maintenance requests, and asset performance. It helps managers monitor day-to-day operations while maintaining a strategic view of property performance. Key metrics like occupancy rate and tenant turnover provide insight into leasing efficiency and revenue stability.
By integrating data from property management systems and inventory management tools, dashboards help managers track performance across individual properties and entire portfolios. This visibility enables proactive management and supports better tenant experiences. A well-designed property management dashboard empowers teams to manage assets effectively and optimize operational workflows.
Monitoring Occupancy Rate Across Property Portfolios
Monitoring occupancy rate across property portfolios is critical for revenue optimization and risk management. Dashboards track occupancy trends by property, region, or asset class, providing a view of portfolio health. This information helps real estate investors and managers identify underperforming assets and take corrective action.
Real Estate Dashboards consolidate occupancy data across multiple properties, offering a clear view of performance across large property portfolios. By visualizing occupancy trends, managers can make informed leasing and pricing decisions. This capability supports strategic planning and enhances portfolio performance.
Management Dashboard for Real Estate Property Portfolios
A management dashboard for property portfolios provides executives and asset managers with high-level insights into portfolio performance. It aggregates data such as occupancy, net operating income, asset value, and risk indicators into a single view.
This dashboard enables managers to monitor performance across properties and compare results against benchmarks. By offering a comprehensive view of portfolio performance, management dashboards support strategic decision-making and long-term investment planning. They also help align operational activities with business objectives.
KPIs, Metrics, and Performance Dashboards
Key Performance Indicators and KPIs in a Real Estate Dashboard
Key performance indicators (KPIs) are the foundation of any effective real estate dashboard. Common KPIs include occupancy rate, net operating income, revenue growth, expense ratios, and asset utilization. These metrics provide insight into financial and operational health.
A KPI dashboard consolidates these indicators into a single interface, enabling consistent monitoring. By tracking KPIs over time, organizations can identify trends, evaluate performance, and support data-driven decisions. Clear KPI definitions ensure alignment across teams and stakeholders.
KPI Dashboard for Tracking Property and Agent Performance
A KPI dashboard tracks both property performance and agent performance in one place. For sales-driven organizations, monitoring agent productivity, deal conversion rates, and sales cycle duration is essential. The dashboard provides visibility into individual and team performance.
By combining sales dashboards with property metrics, organizations gain a holistic view of performance. This integrated approach supports accountability, performance improvement, and incentive planning. KPI dashboards empower managers to coach teams effectively and optimize results.
Performance Dashboard for Real Estate Development and Operations
A performance dashboard supports real estate development projects by tracking timelines, costs, and milestones. It integrates development data with operational metrics, providing insight into project health and progress.
Performance dashboards help organizations manage risk, control costs, and ensure alignment with strategic goals. By visualizing performance across development projects and operations, dashboards enable proactive management and timely interventions.
Financial and Sales Dashboards for Real Estate
Financial Dashboard for Real Estate Business and Property Performance
A financial dashboard provides real estate organizations with visibility into revenue, expenses, and profitability. Key metrics such as net operating income and cash flow help assess financial health. Dashboards integrate data from accounting systems and property databases to ensure accuracy.
Financial dashboards support budgeting, forecasting, and investment analysis. By visualizing financial data, organizations can identify opportunities for cost optimization and revenue growth. This insight is essential for maintaining financial stability and investor confidence.
Real Estate Sales Dashboard for Sales Metrics and Agent Performance
A real estate sales dashboard tracks sales metrics such as deal volume, conversion rates, and revenue by agent. It integrates CRM data with sales dashboards to provide a complete view of sales performance.
This dashboard helps managers monitor agent productivity and identify high performers. By analyzing sales data, organizations can optimize sales strategies and improve outcomes. Sales dashboards also support transparency and accountability across teams.
Sales Dashboards for Monitoring Revenue and Transactions
Sales dashboards focus on revenue trends and transaction activity. They provide insight into pipeline performance and deal progression. By consolidating sales data from multiple sources, dashboards offer a clear view of revenue generation.
These dashboards enable managers to monitor performance in real time and make adjustments as needed. Sales dashboards support informed decision-making and revenue optimization.
Dashboard Templates, Software, and Customization
Using a Dashboard Template for Real Estate Management
A dashboard template accelerates deployment by providing predefined layouts and KPIs tailored to real estate management. Templates reduce development time and ensure consistency across dashboards.
By using templates, organizations can focus on customization and analysis rather than design. Templates support scalability and standardization, making them ideal for growing real estate organizations.
Dashboard Software and Management System Integration
Dashboard software integrates with real estate management systems, CRM platforms, and BI tools. Integration ensures seamless data flow and accuracy across dashboards.
By pulling data from multiple data sources, dashboard software creates a unified view of operations. This integration supports better reporting, analysis, and decision-making across the organization.
Customizable Dashboards Tailored to Real Estate Business Needs
Customizable dashboards allow organizations to tailor visualizations and metrics to fit specific needs. Whether managing commercial property, residential portfolios, or development projects, customization ensures relevance.
Custom dashboards empower users to focus on what matters most, improving adoption and value. This flexibility supports diverse real estate business models and strategies.
Automation, Analytics, and CRM Integration
Analytics-Driven Dashboards for Real Estate Decision-Making
Analytics-driven dashboards transform data into actionable insights. By applying analytics solutions, dashboards identify trends and opportunities across market data and property performance.
These insights support strategic decisions and improve competitiveness. Analytics dashboards help organizations stay ahead in dynamic real estate markets.
CRM and Automation Features in Real Estate Dashboard Solutions
CRM and automation features enhance dashboard functionality by streamlining data capture and reporting. Automation reduces manual effort and improves data accuracy.
CRM integration enables tracking of leads, clients, and agent performance. Together, these features improve efficiency and support growth.
Tailoring Dashboard Solutions for Scalable Real Estate Management
Tailored dashboard solutions support scalability by adapting to organizational growth. Dashboards evolve with changing needs, ensuring long-term value.
By offering flexible, powerful tools, dashboards empower real estate organizations to manage complexity and achieve strategic objectives.
Conclusion
A Real Estate Dashboard Package provides comprehensive visibility into property performance, financial outcomes, and sales activity. By consolidating data, enabling analytics, and supporting automation, dashboards empower real estate organizations to make data-driven decisions, streamline operations, and drive sustainable growth across property portfolios.
For ready-to-use Dashboard Templates: