Introduction to the Construction Dashboard Package
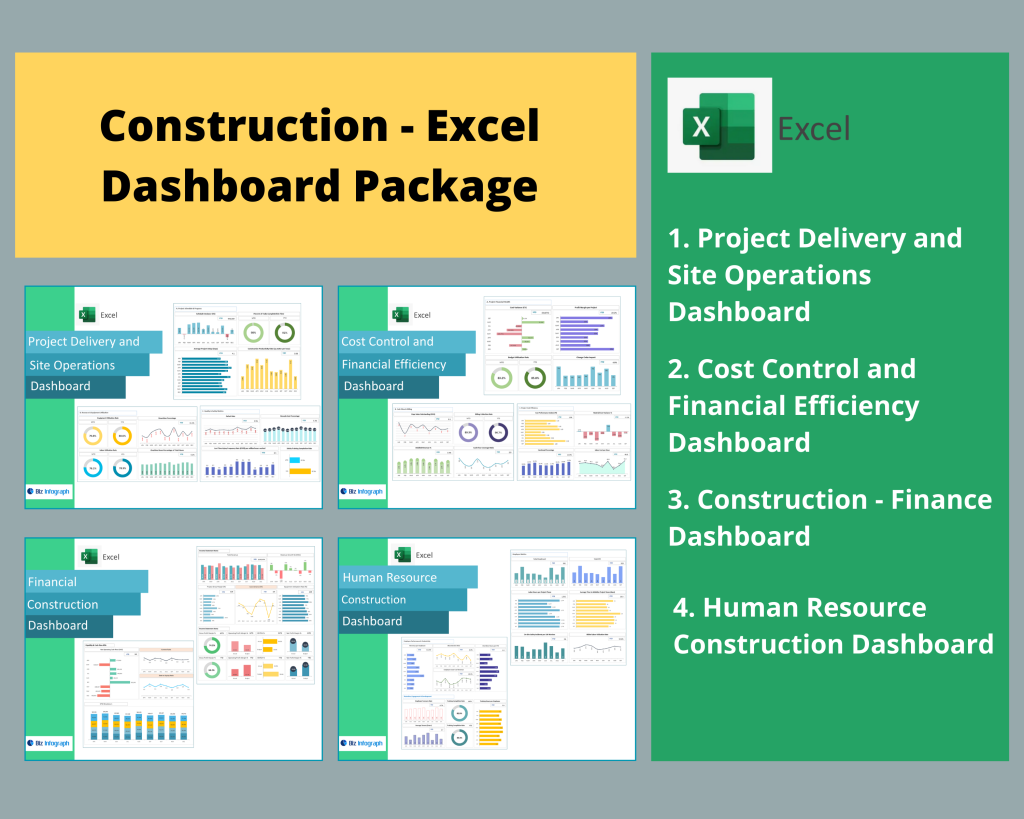
What Is a Construction Dashboard and Why It’s Essential
A construction dashboard is a powerful tool designed to give project stakeholders a visual overview of ongoing and completed tasks, key performance indicators (KPIs), and financial health. Built using tools like Excel construction templates, dashboard software, or cloud platforms, these dashboards centralize critical data such as budget, timeline, and progress. For construction project managers, having a dashboard helps manage complexity across multiple work packages and track project completion. With real-time data, project managers can visualize progress, identify risks, and make informed decisions that keep the construction project within budget and on schedule.
Benefits of Using a Real-Time Dashboard for Construction Projects
Implementing a real-time construction dashboard helps companies manage multiple projects with greater efficiency. Using a construction project management dashboard, project teams can monitor updates instantly, respond to changing timelines, and maintain project health. These dashboards are critical for construction project tracking, especially when using scheduling software to map out the critical path. Project managers can get a high-level view of the overall status, improving collaboration and resource allocation. With customizable features, free construction dashboard templates allow smaller teams to achieve the same visibility and control as larger firms.
Core Components of a Construction Project Dashboard
Key Metrics and KPIs Included in a Construction Dashboard
Every successful construction project dashboard tracks key performance indicators such as project cost, construction schedule adherence, and task progress. These KPIs are vital for measuring project health and project control. A well-built cost dashboard will include data on construction budget, construction estimates, and the percentage of project tasks completed. By integrating this data with project management templates, teams can track whether the construction project is on time and within budget. This management dashboard not only measures past performance but also supports forecasting for future milestones.
Project Status, Budget, and Forecast Tracking in One View
A project management dashboard should consolidate construction financial information, project status, and timeline forecasts in one user-friendly interface. With dashboard software, project teams and construction project managers can monitor the health of the project across cost, timeline, and quality metrics. Whether using an Excel spreadsheet or a more robust cloud-based solution, tracking project status reports and budget forecasts is essential to monitoring progress and achieving project execution goals. Dashboards for construction provide a single source of truth that improves accountability across teams.
Monitoring Construction Project Schedule and Critical Path
Tracking a construction schedule and critical path is essential to delivering projects on time. A construction management dashboard helps identify potential issues early, enabling construction project managers to adjust timelines, reallocate resources, or shift priorities. The project schedule section in a dashboard shows task dependencies, forecasted delays, and key milestones. A free template or advanced dashboard template can be tailored to display day-to-day activities alongside high-level views. This supports better coordination between field crews, subcontractors, and management, improving the odds of timely completion and client satisfaction.
Dashboard Templates and Tools for Construction Managers
Excel Construction Dashboard Templates and Spreadsheet Solutions
Many small to mid-sized companies rely on Excel construction dashboard templates as a cost-effective way to monitor performance. With spreadsheet-based dashboards, you can track project cost, schedules, and progress visually. These templates are especially useful for project status reports and allow for customized tracking of tasks and KPIs. A construction project dashboard template built in Excel may include sections for construction estimate, labor allocation, work packages, and actual vs. forecasted progress. These tools are not only flexible but are easy to share, automate, and integrate into existing construction processes.
Real-Time Dashboards for Project Cost and Budget Management
Keeping your construction project in real time and within budget requires advanced tools. A real-time cost dashboard allows you to see construction cost breakdowns, budget forecasts, and current spend across all project elements. Whether you’re managing a single project or a portfolio, dashboard software provides centralized access to data from multiple data sources. This enables real-time data visualization for critical metrics like total project cost, cost variance, and percentage complete. It supports more accurate forecasting and ensures that teams can adjust pricing, scope, or timelines proactively.
Using a Project Dashboard for Portfolio and Program Management
For firms managing multiple projects, a portfolio management dashboard is vital. This type of advanced project dashboard offers visibility into all current initiatives, helping executives and project managers align efforts with strategic objectives. These dashboards track high-level KPIs across construction businesses, offering a comprehensive view of schedule, construction financials, and operational performance. With tools like program management dashboards, it’s easier to spot at-risk projects, redistribute resources, and maintain company-wide consistency. Templates for these dashboards are often fully customizable, integrating seamlessly with modern construction project management systems.
Enhancing Project Management with Dashboards
How Project Managers Use Dashboards to Track Tasks and Timelines
Project managers rely on project management dashboards to manage thousands of moving parts. By tracking each project task against milestones, teams can detect lags or bottlenecks early. A modern dashboard for construction provides alerts, visual indicators, and reports that support real-time tracking and project progress monitoring. These tools are key for high-pressure roles like frontline construction project managers, where timely decisions affect costs and timelines. Construction dashboards also allow for seamless collaboration between finance, operations, and on-site teams.
Creating Construction Project Status Reports with Dashboards
A project status report is easier to produce and understand when generated from a real-time dashboard. With a customizable dashboard template, reports can highlight key performance indicators (KPI), cost overruns, scope changes, and upcoming deadlines. Dashboards eliminate the need for manual spreadsheet consolidation by pulling from construction project trackers and central systems. Whether shared weekly or monthly, these reports help teams, clients, and stakeholders stay aligned. Visualizing data like construction budget health or project schedule progress builds transparency and strengthens communication across teams.
Advanced Project and Financial Tracking for the Construction Business
Modern construction businesses require advanced tools to stay competitive. A construction financial dashboard integrates financial data such as revenue, profit margins, profit margins graph, and construction costs into visual reports. It also shows project completion rates, unbilled expenses, and forecasts. These dashboards support real-time project insights across departments like finance, procurement, and site operations. Dashboard templates that focus on project cost tracking, revenue recognition, and ROI analysis help construction project managers manage risk and report to leadership with confidence. These are not just reports—they’re strategic assets.
For ready-to-use Dashboard Templates: